Playing with DALL·E mini

DALL·E 2 is a multimodal AI system that generates images from text. OpenAI announced the model in April 2022. OpenAI is known for GPT-3, an autoregressive language model with 175 billion parameters. DALL·E 2 uses a smaller version of GPT-3. Read more herehere, and here (the last one also slightly discusses Google’s image).

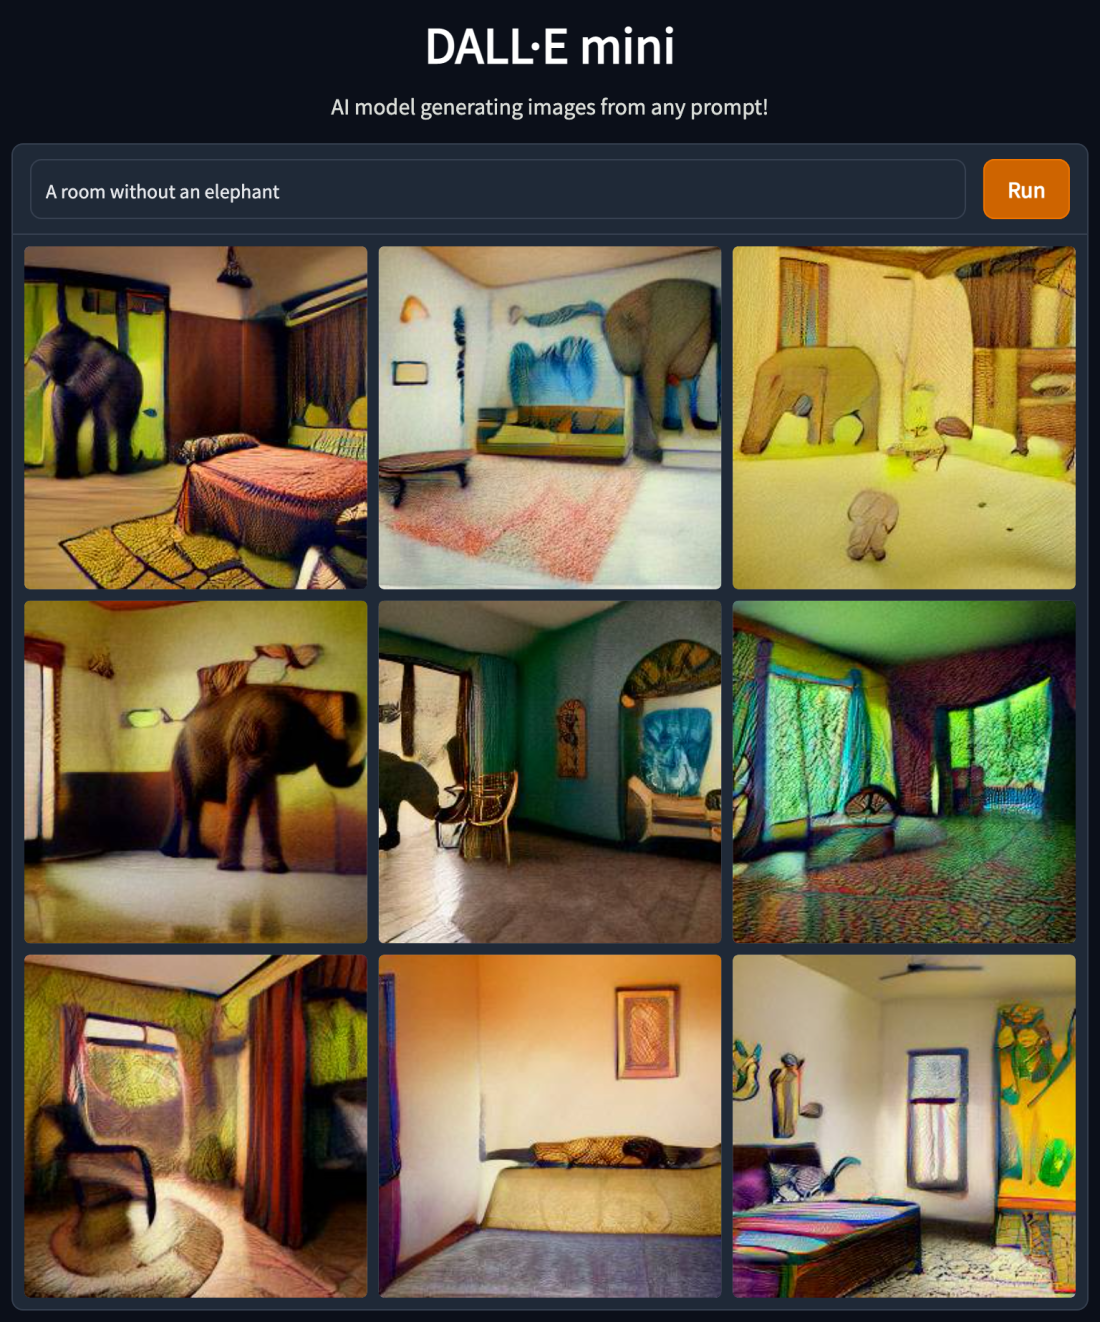
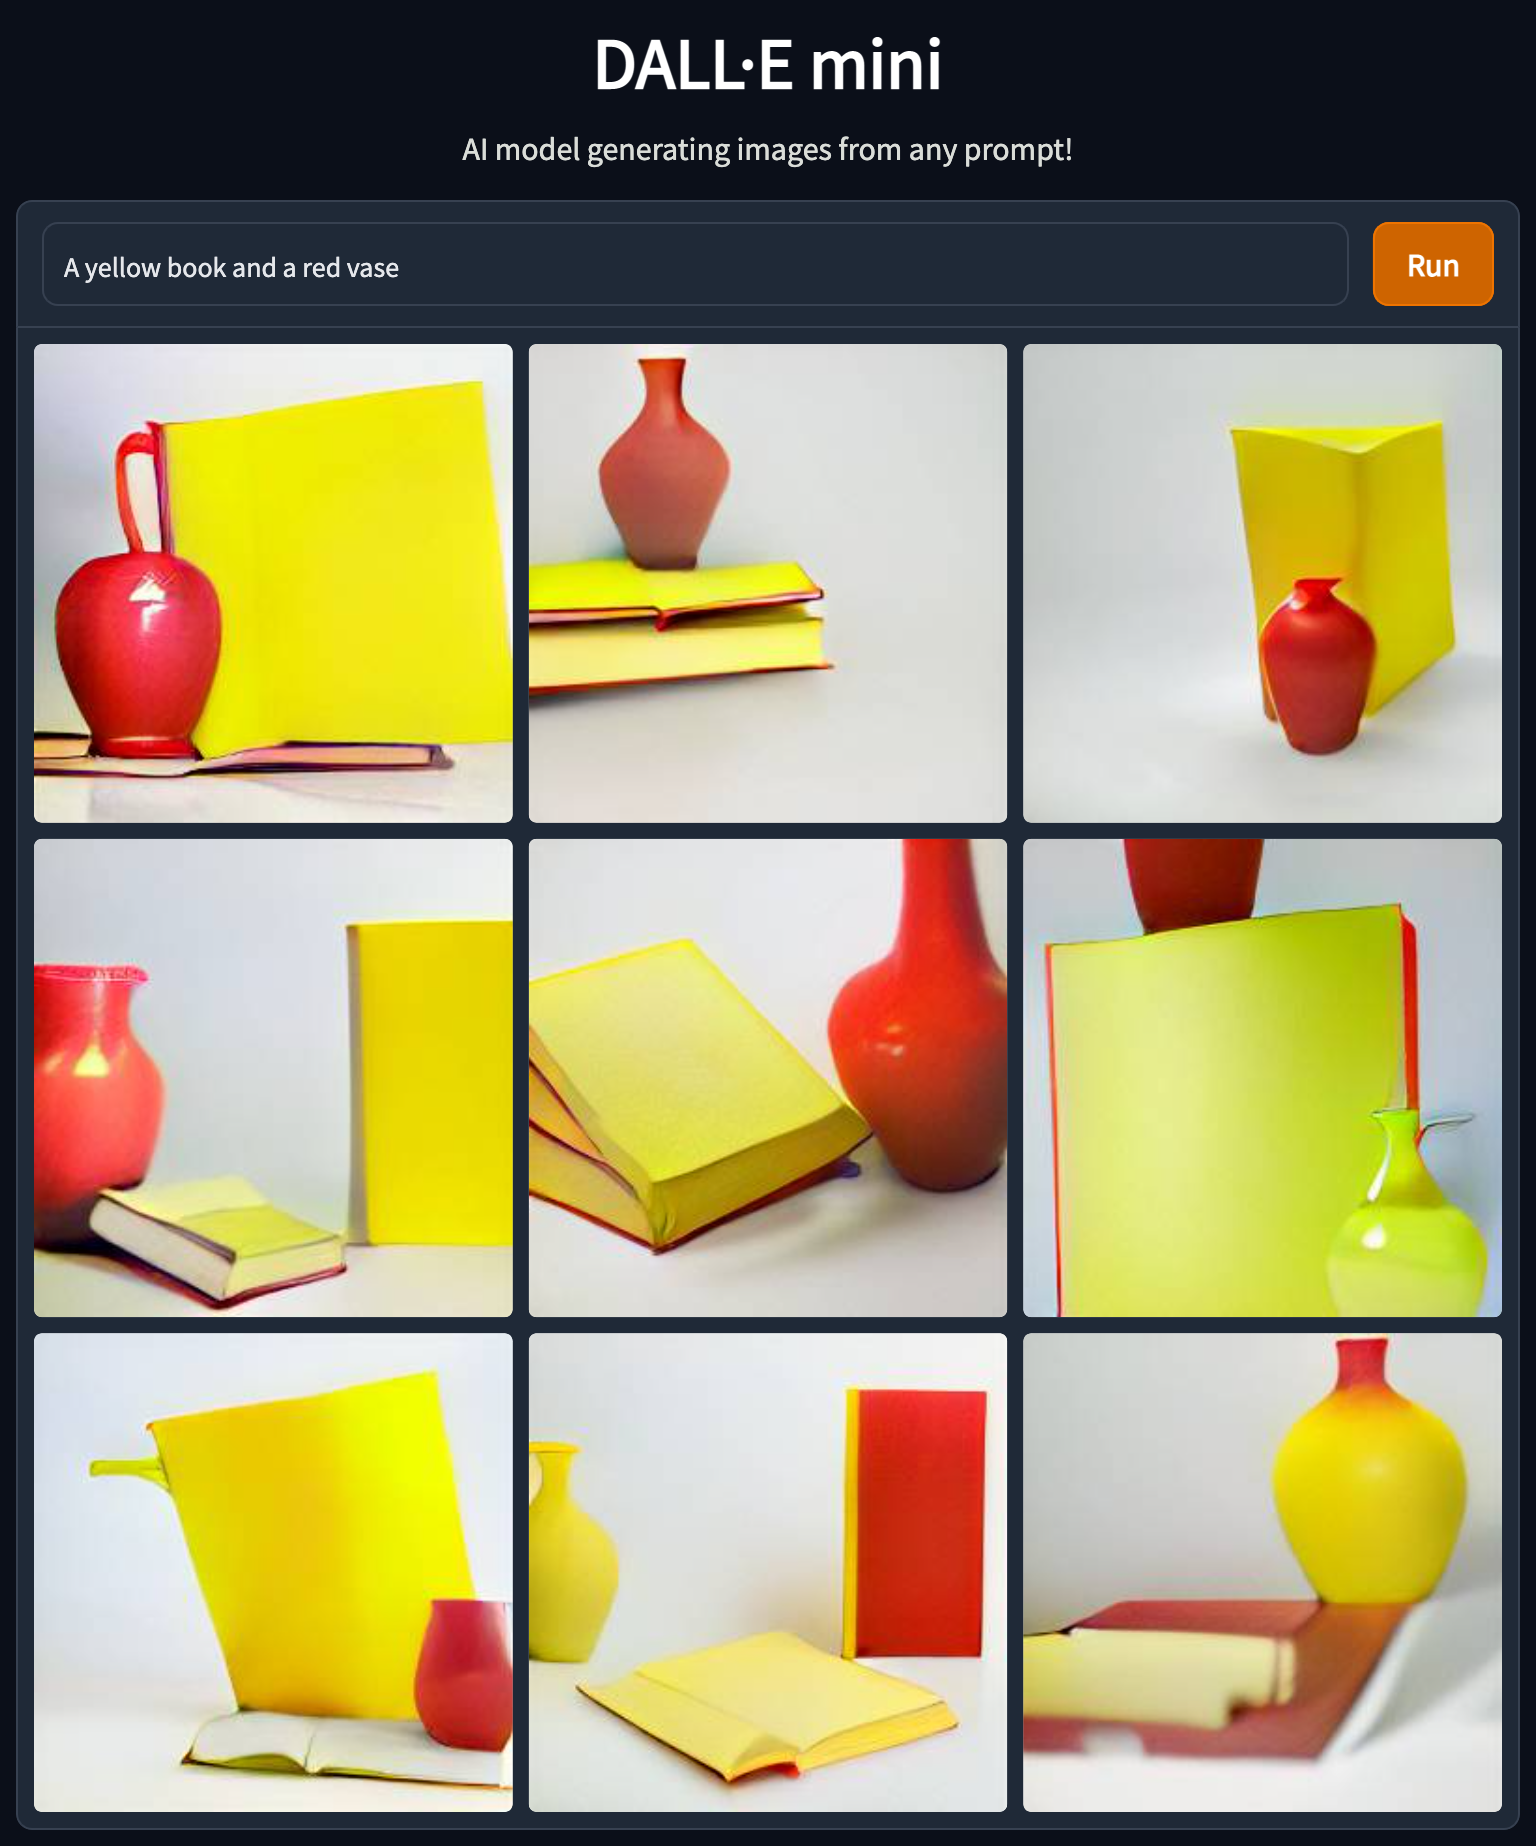
While the results look impressive at first sight, there are some caveats and limitations, including word order and compositionality issues, e.g., “A yellow book and a red vase” from “A red book and a yellow vase” are indistinguishable. Moreover, as one can see in the “A yellow book and a red vase” example below the images or more of the same, another drawback is that the system cannot handle negation, e.g., “A room without an elephant” will create, well, see below. Read more here.

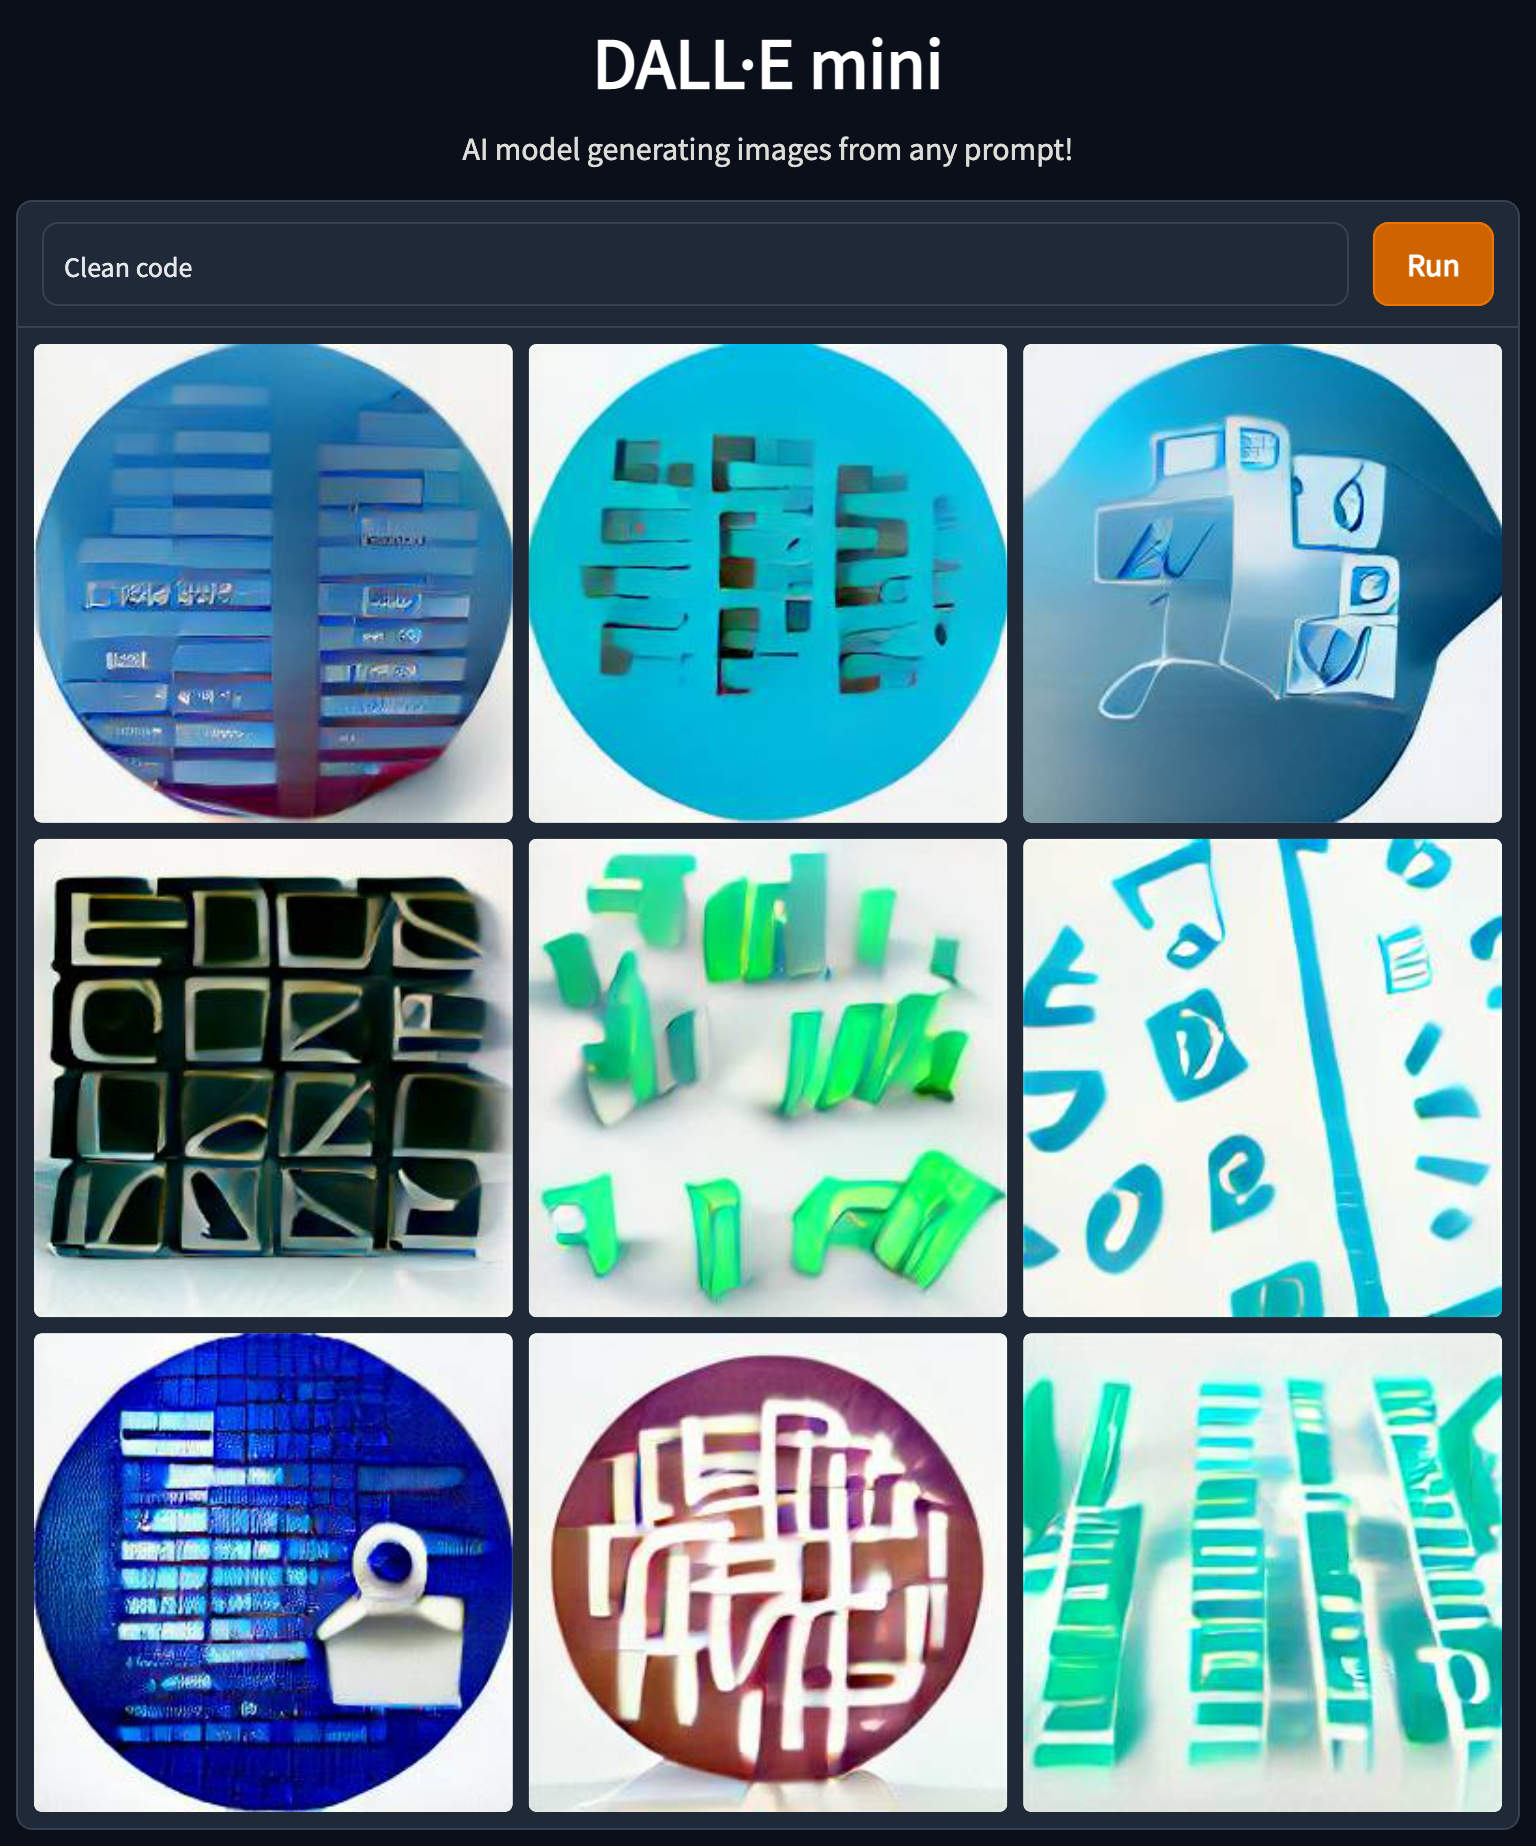
Since I don’t have access to DALL·E 2, I used DALL·E mini via Hugging Face for all the examples in this post. However, the two models experience the same issues.

A yellow book and a red vase
A room without an elephant

The model might have biases for example check all those software developers who write code, all men (also note that the face are very blurry in contrast to other surfaces in the images) –

software developer writing code
A CTO giving a talk

I decided to troll that a bit to find more limitations or point-out blind spots. Check out the following examples –

Object Oriented Programming
OOP
Object Disoriented Programming
Exploratory Data Analysis
EDA

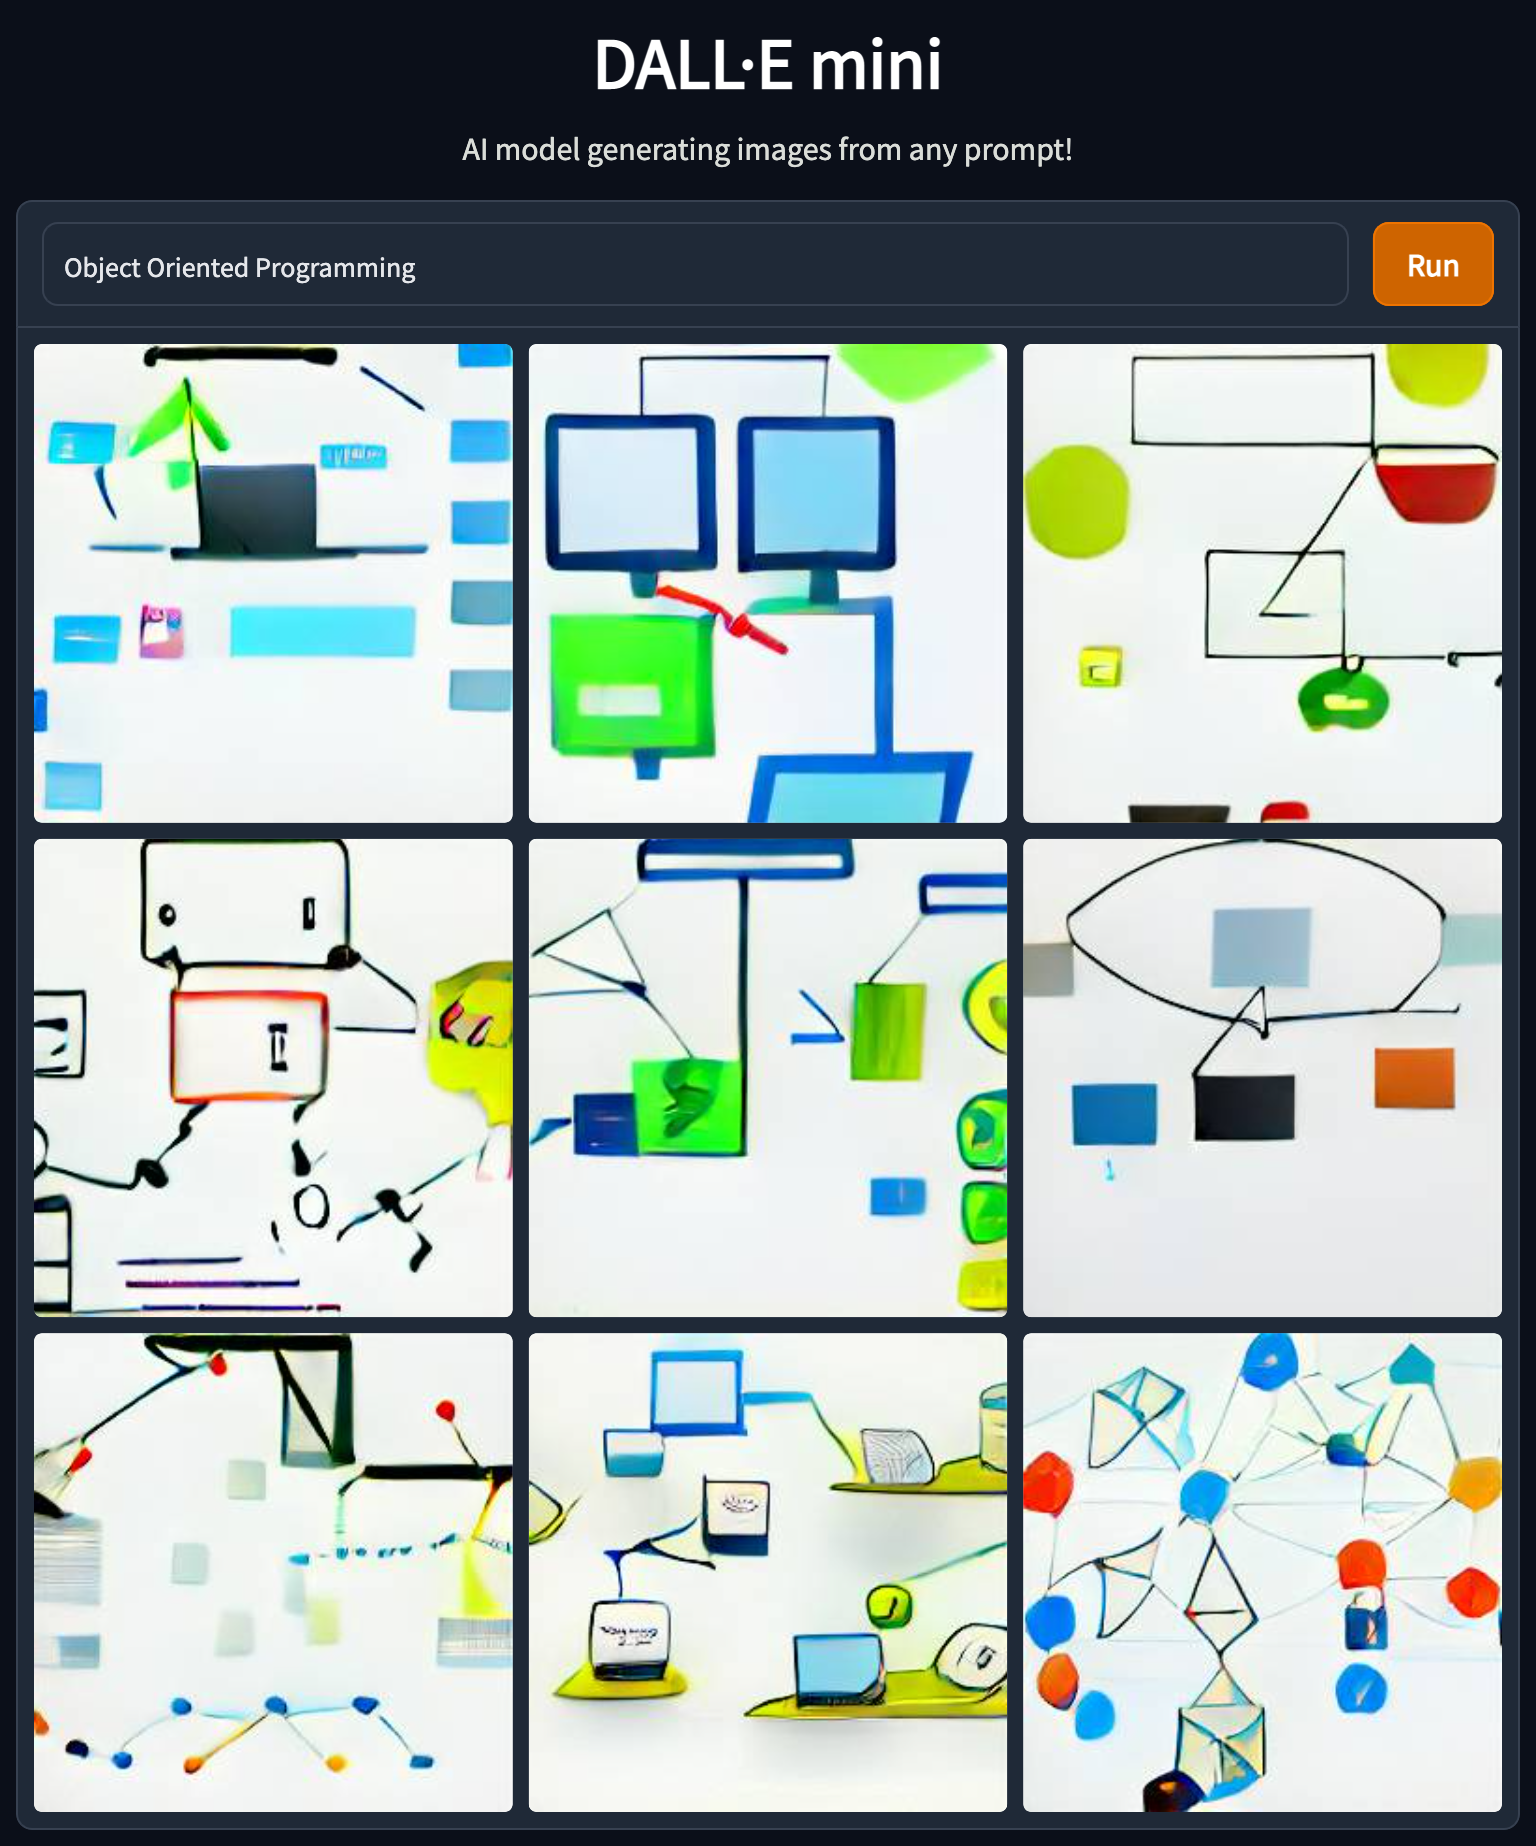
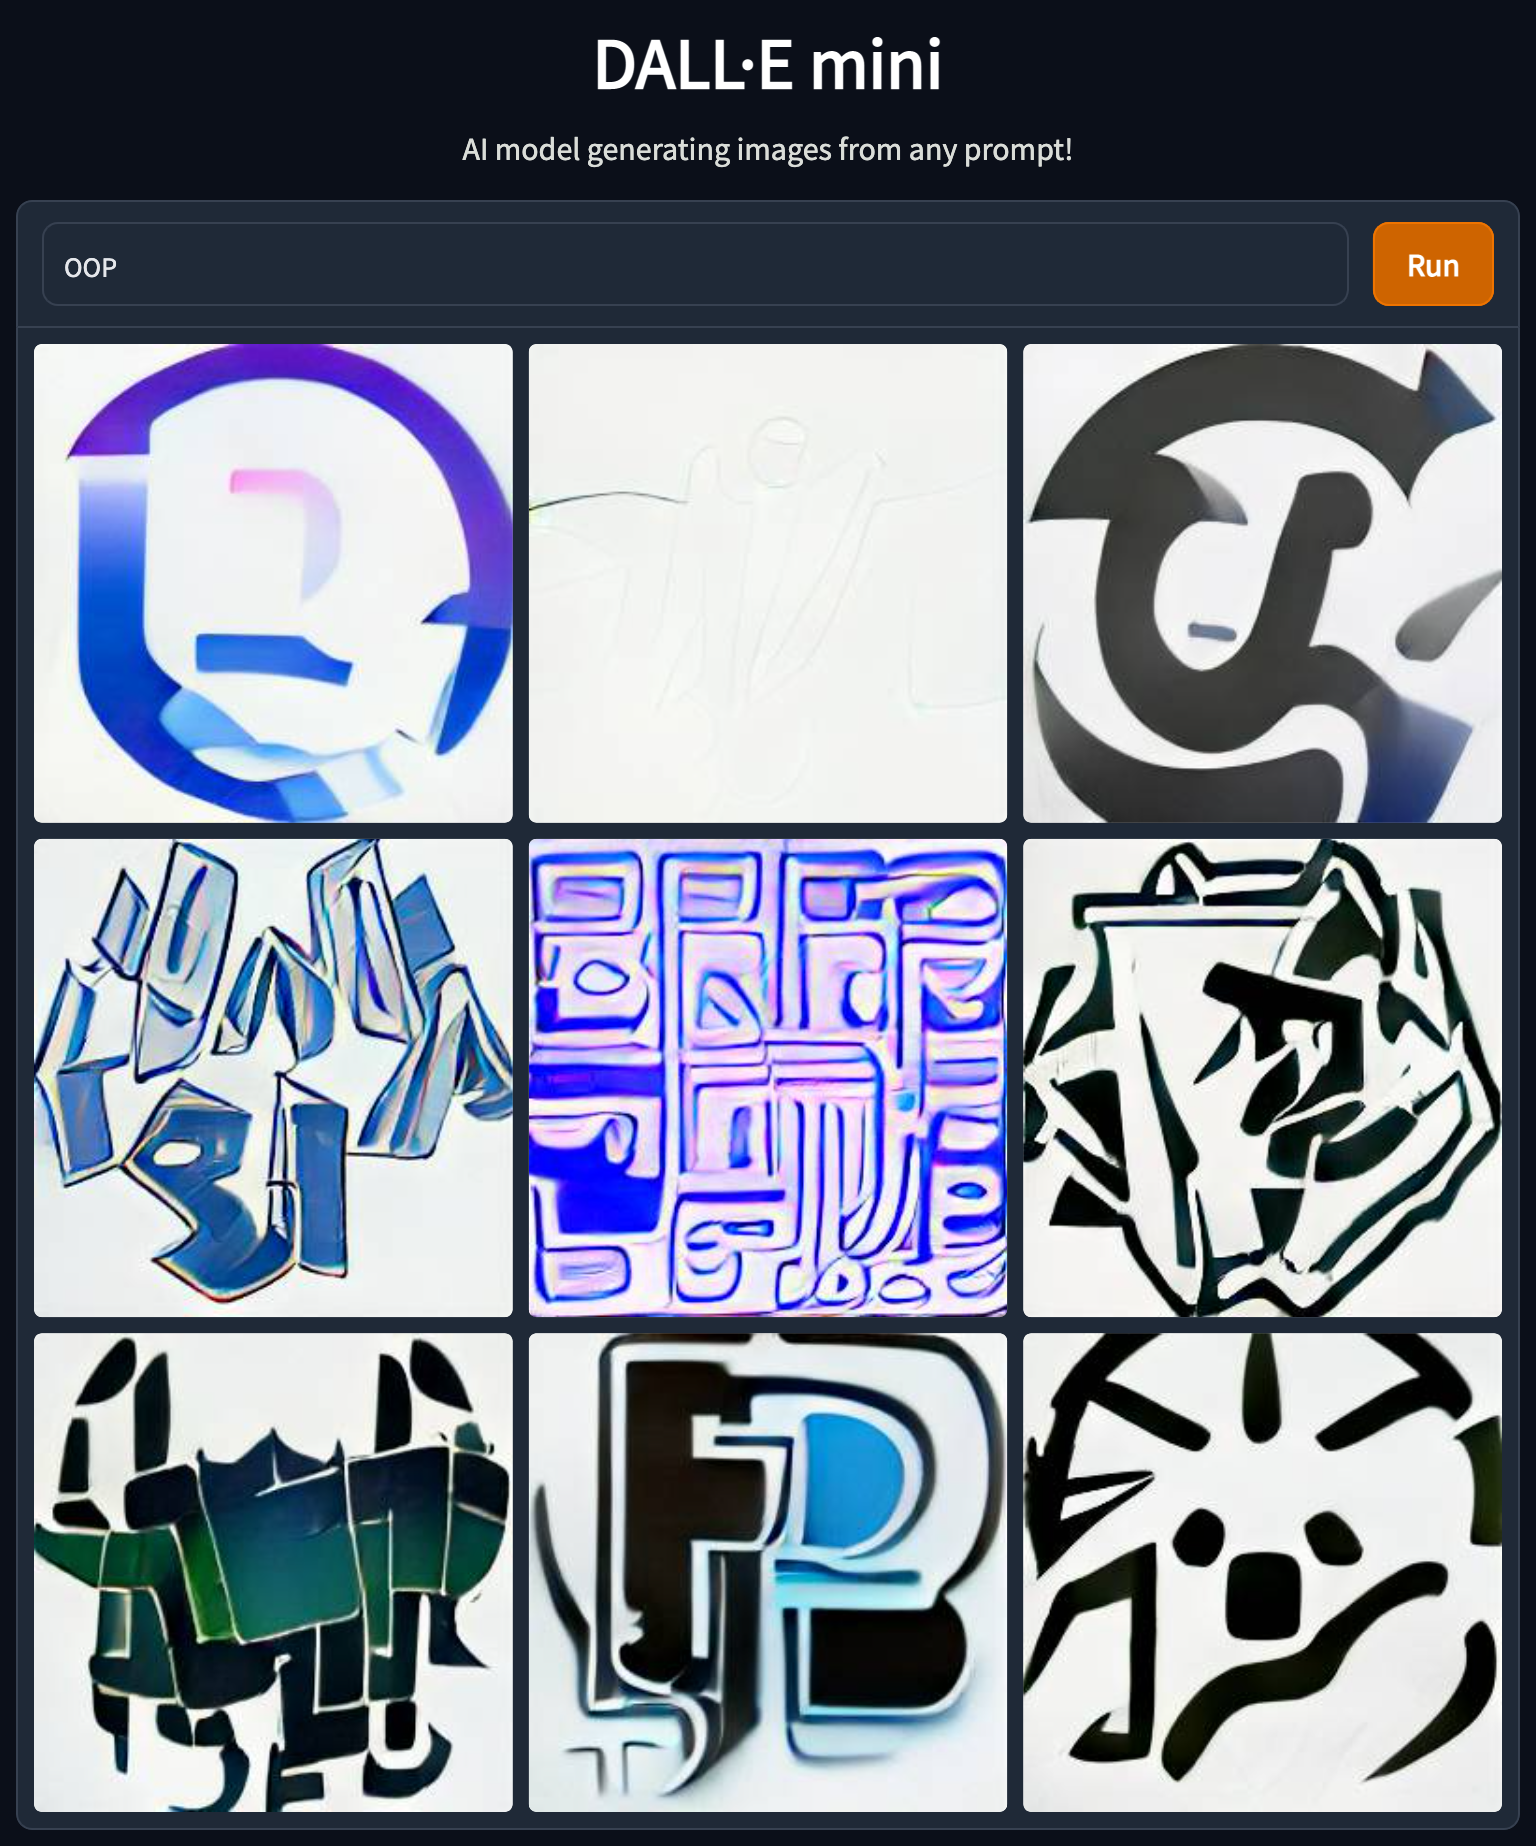
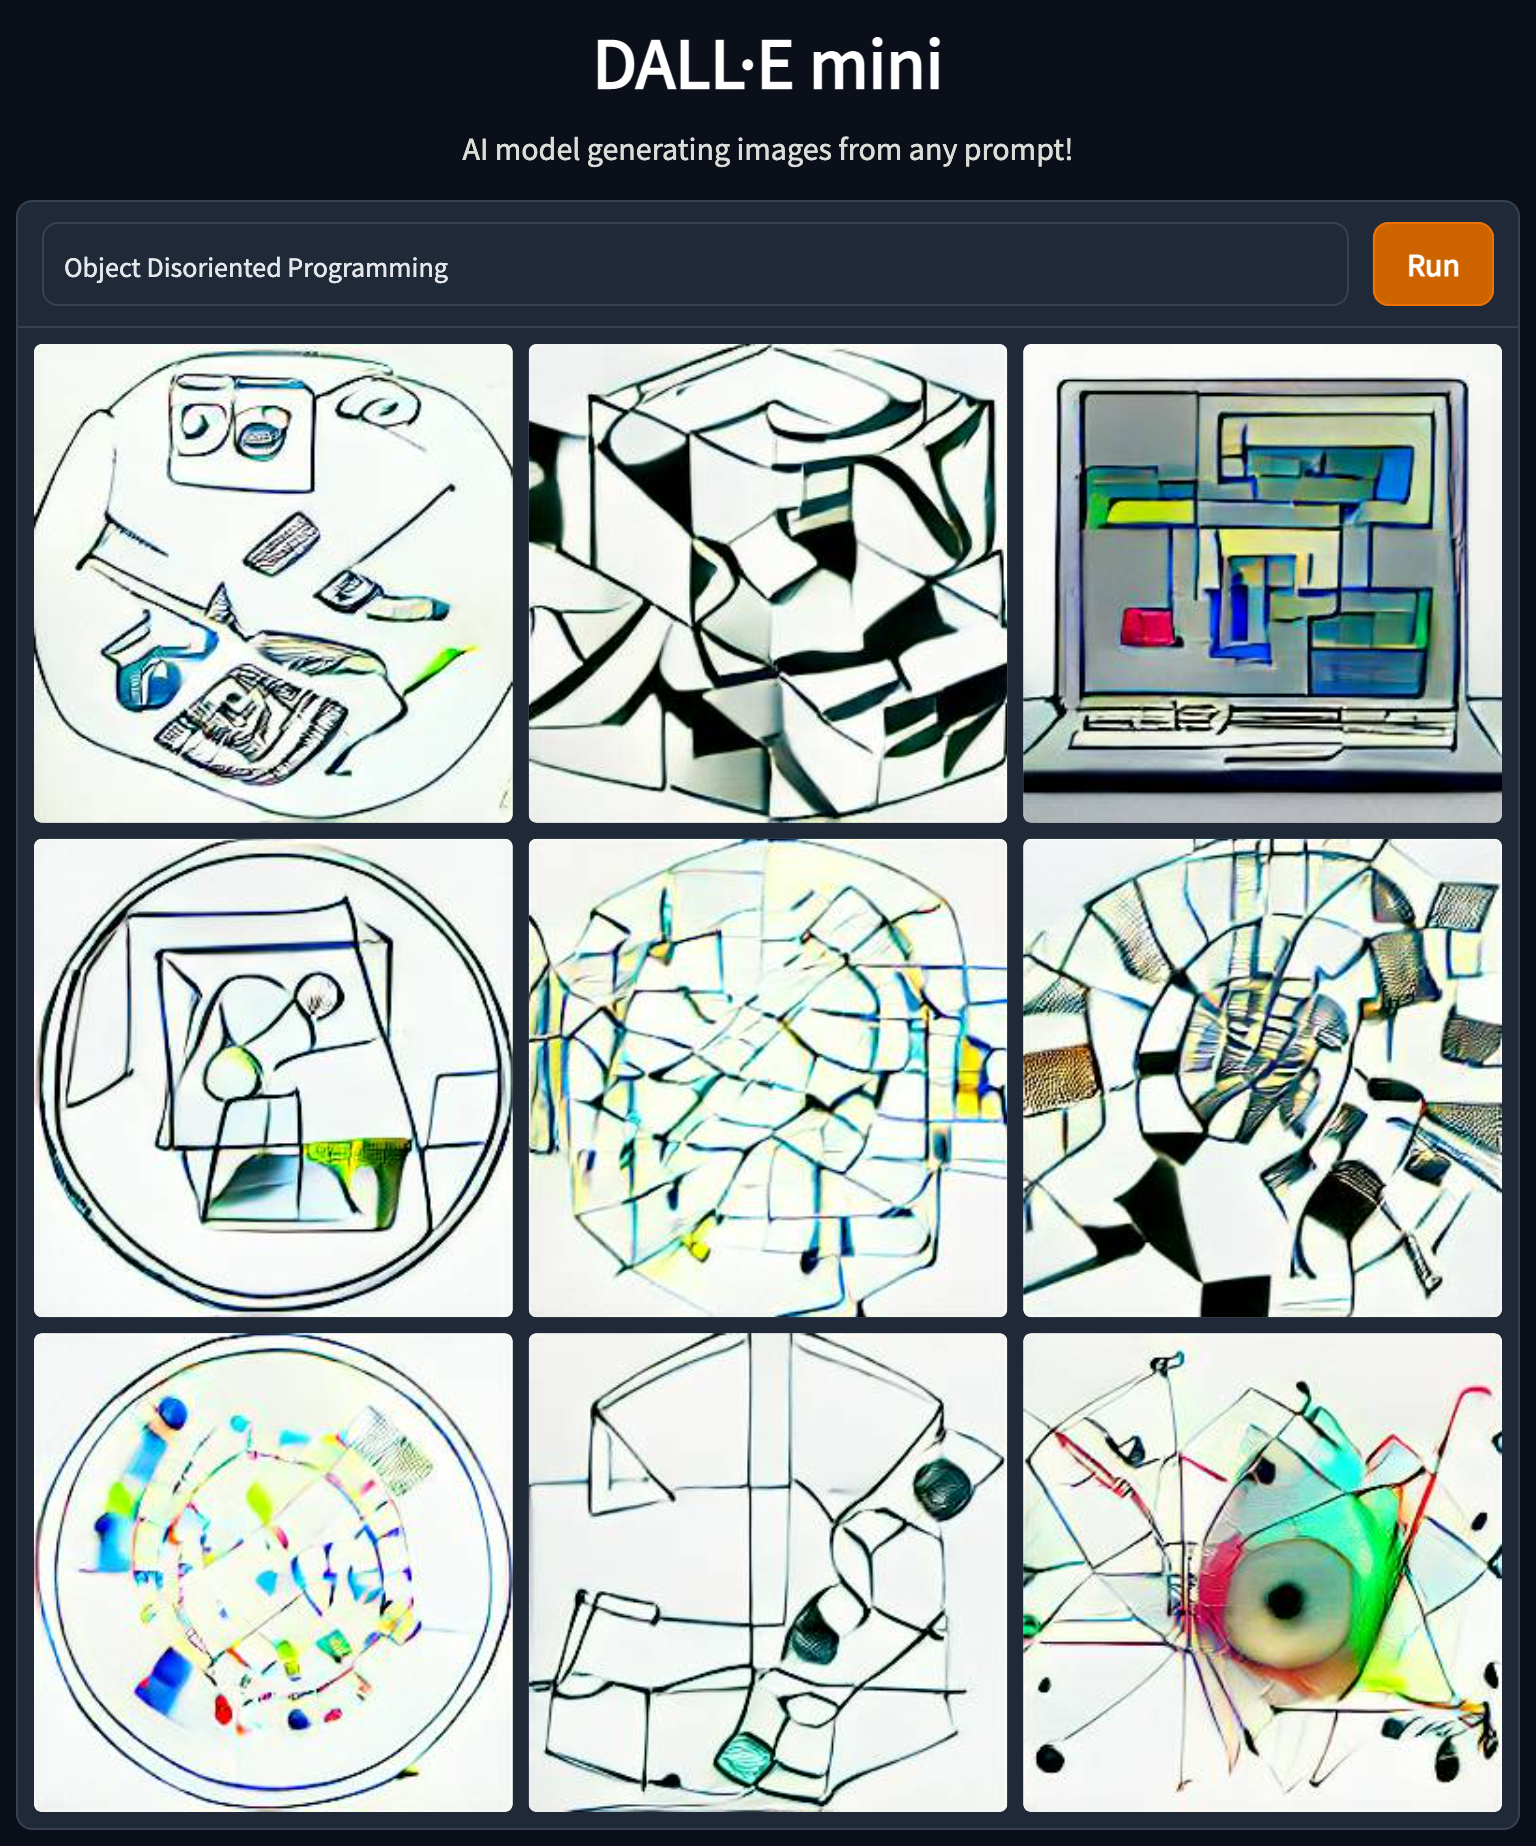
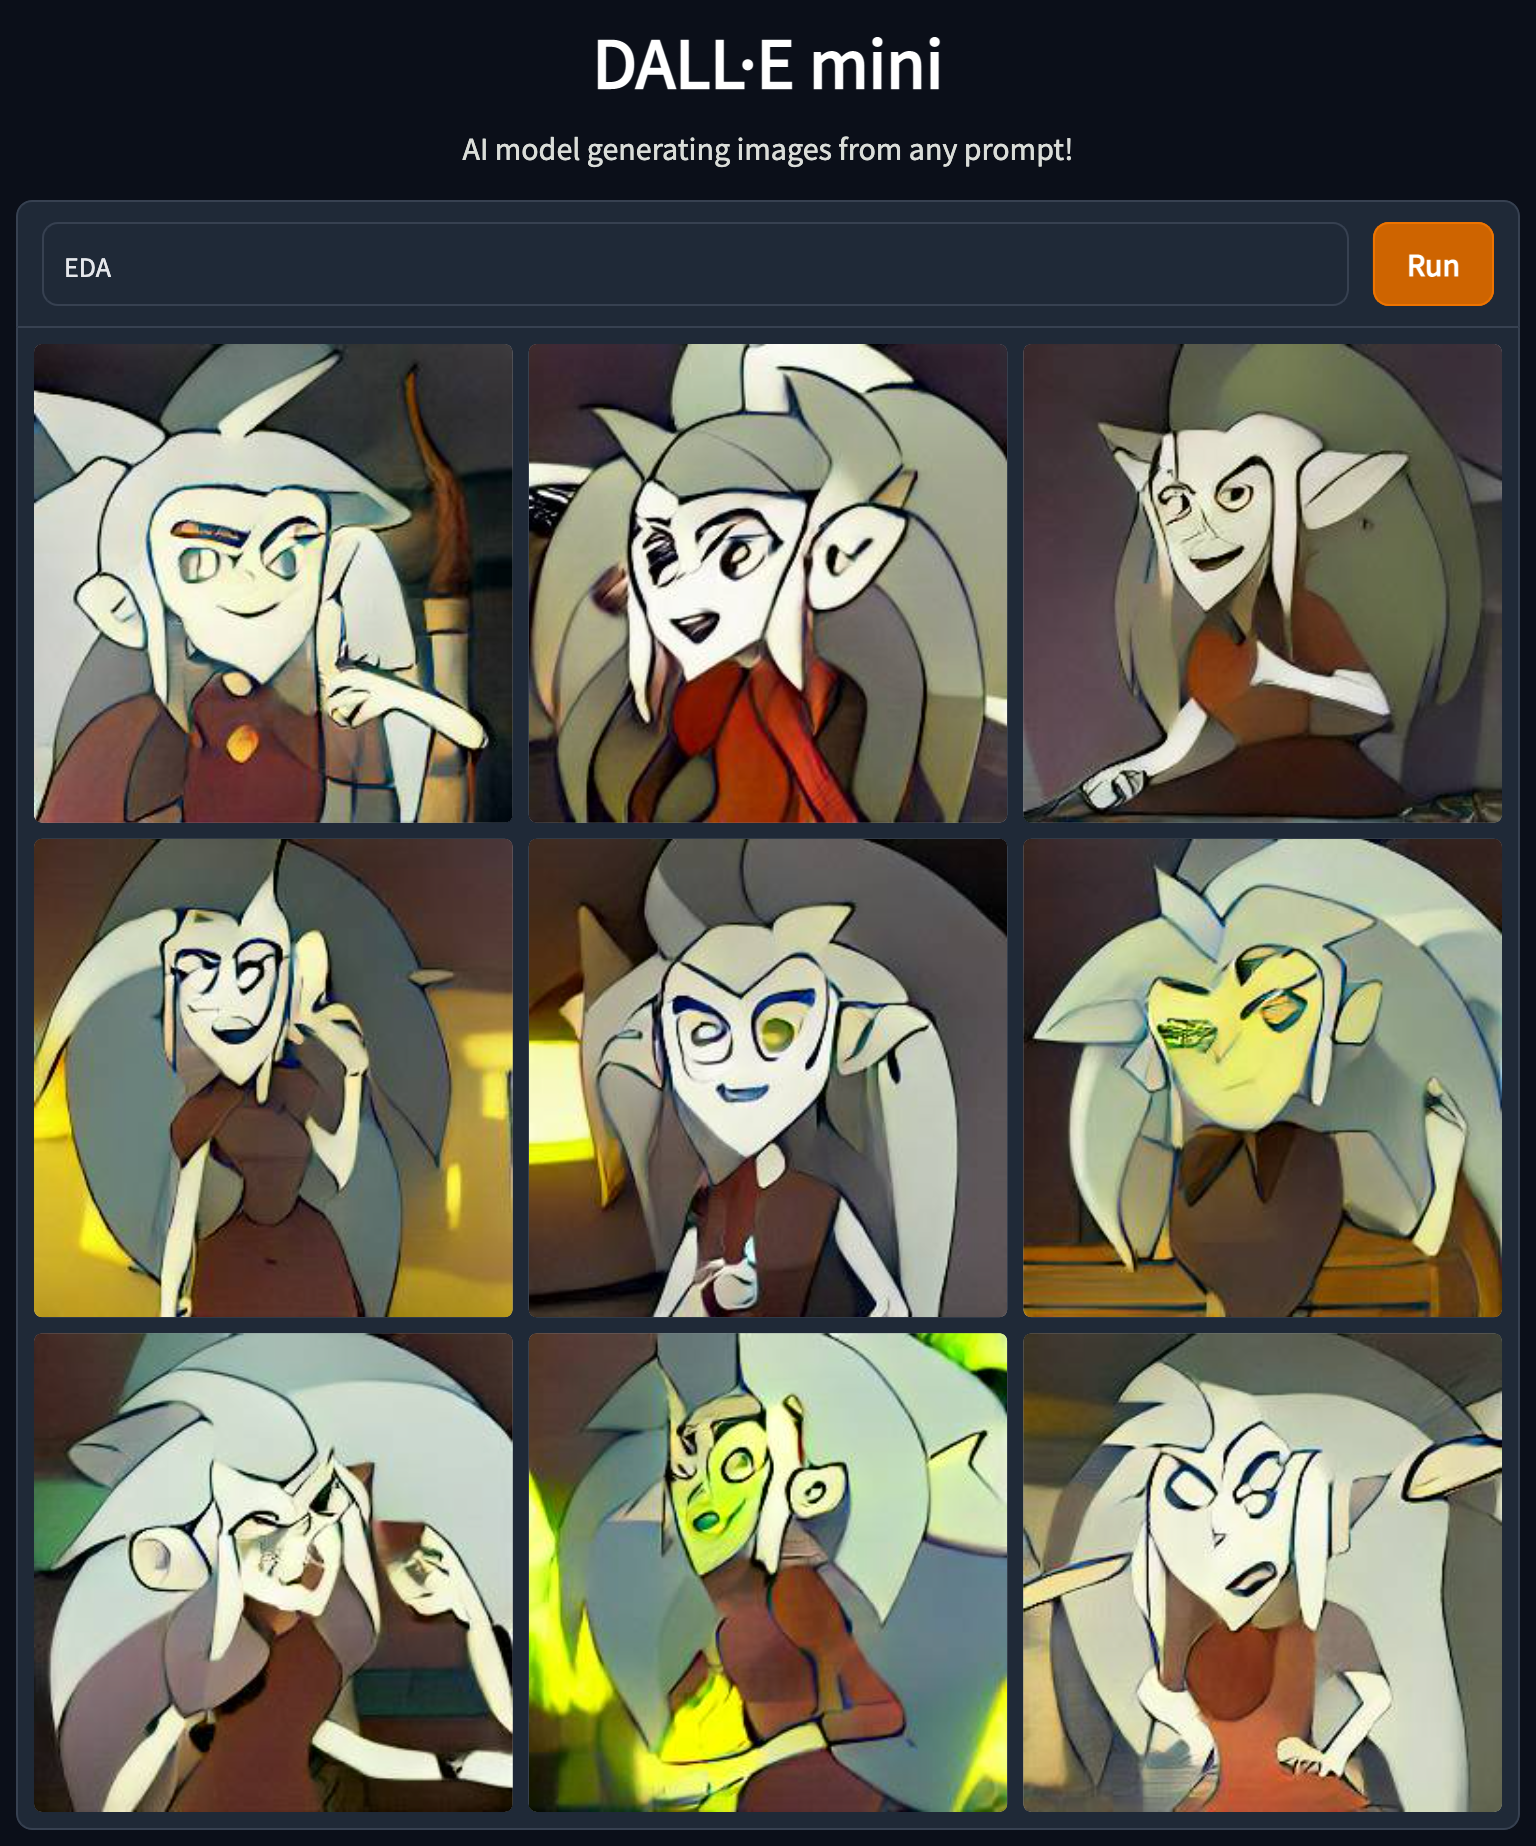
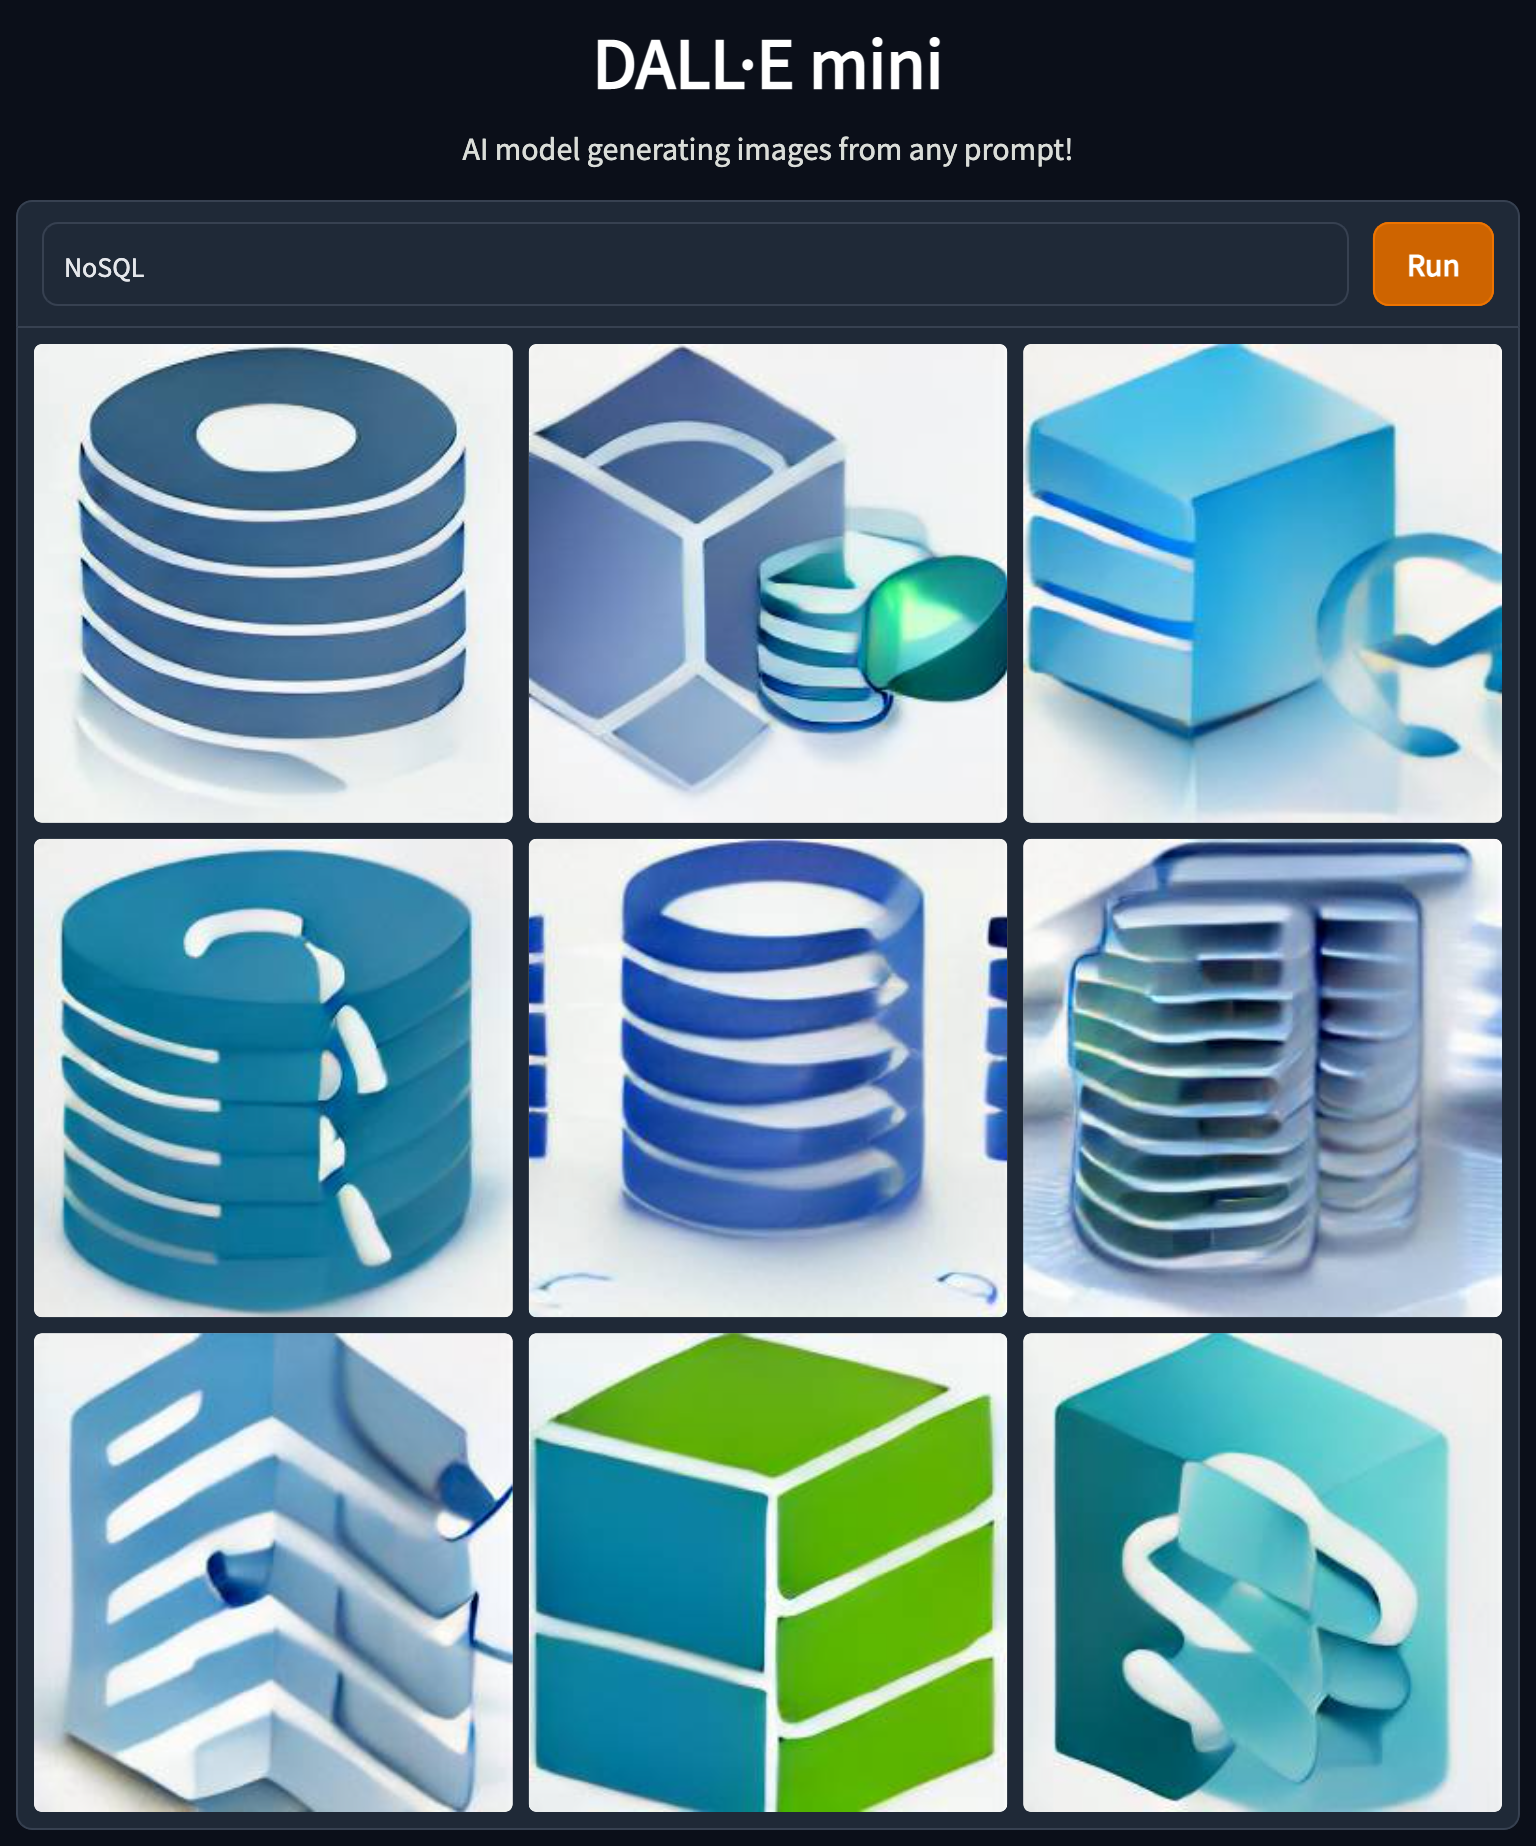
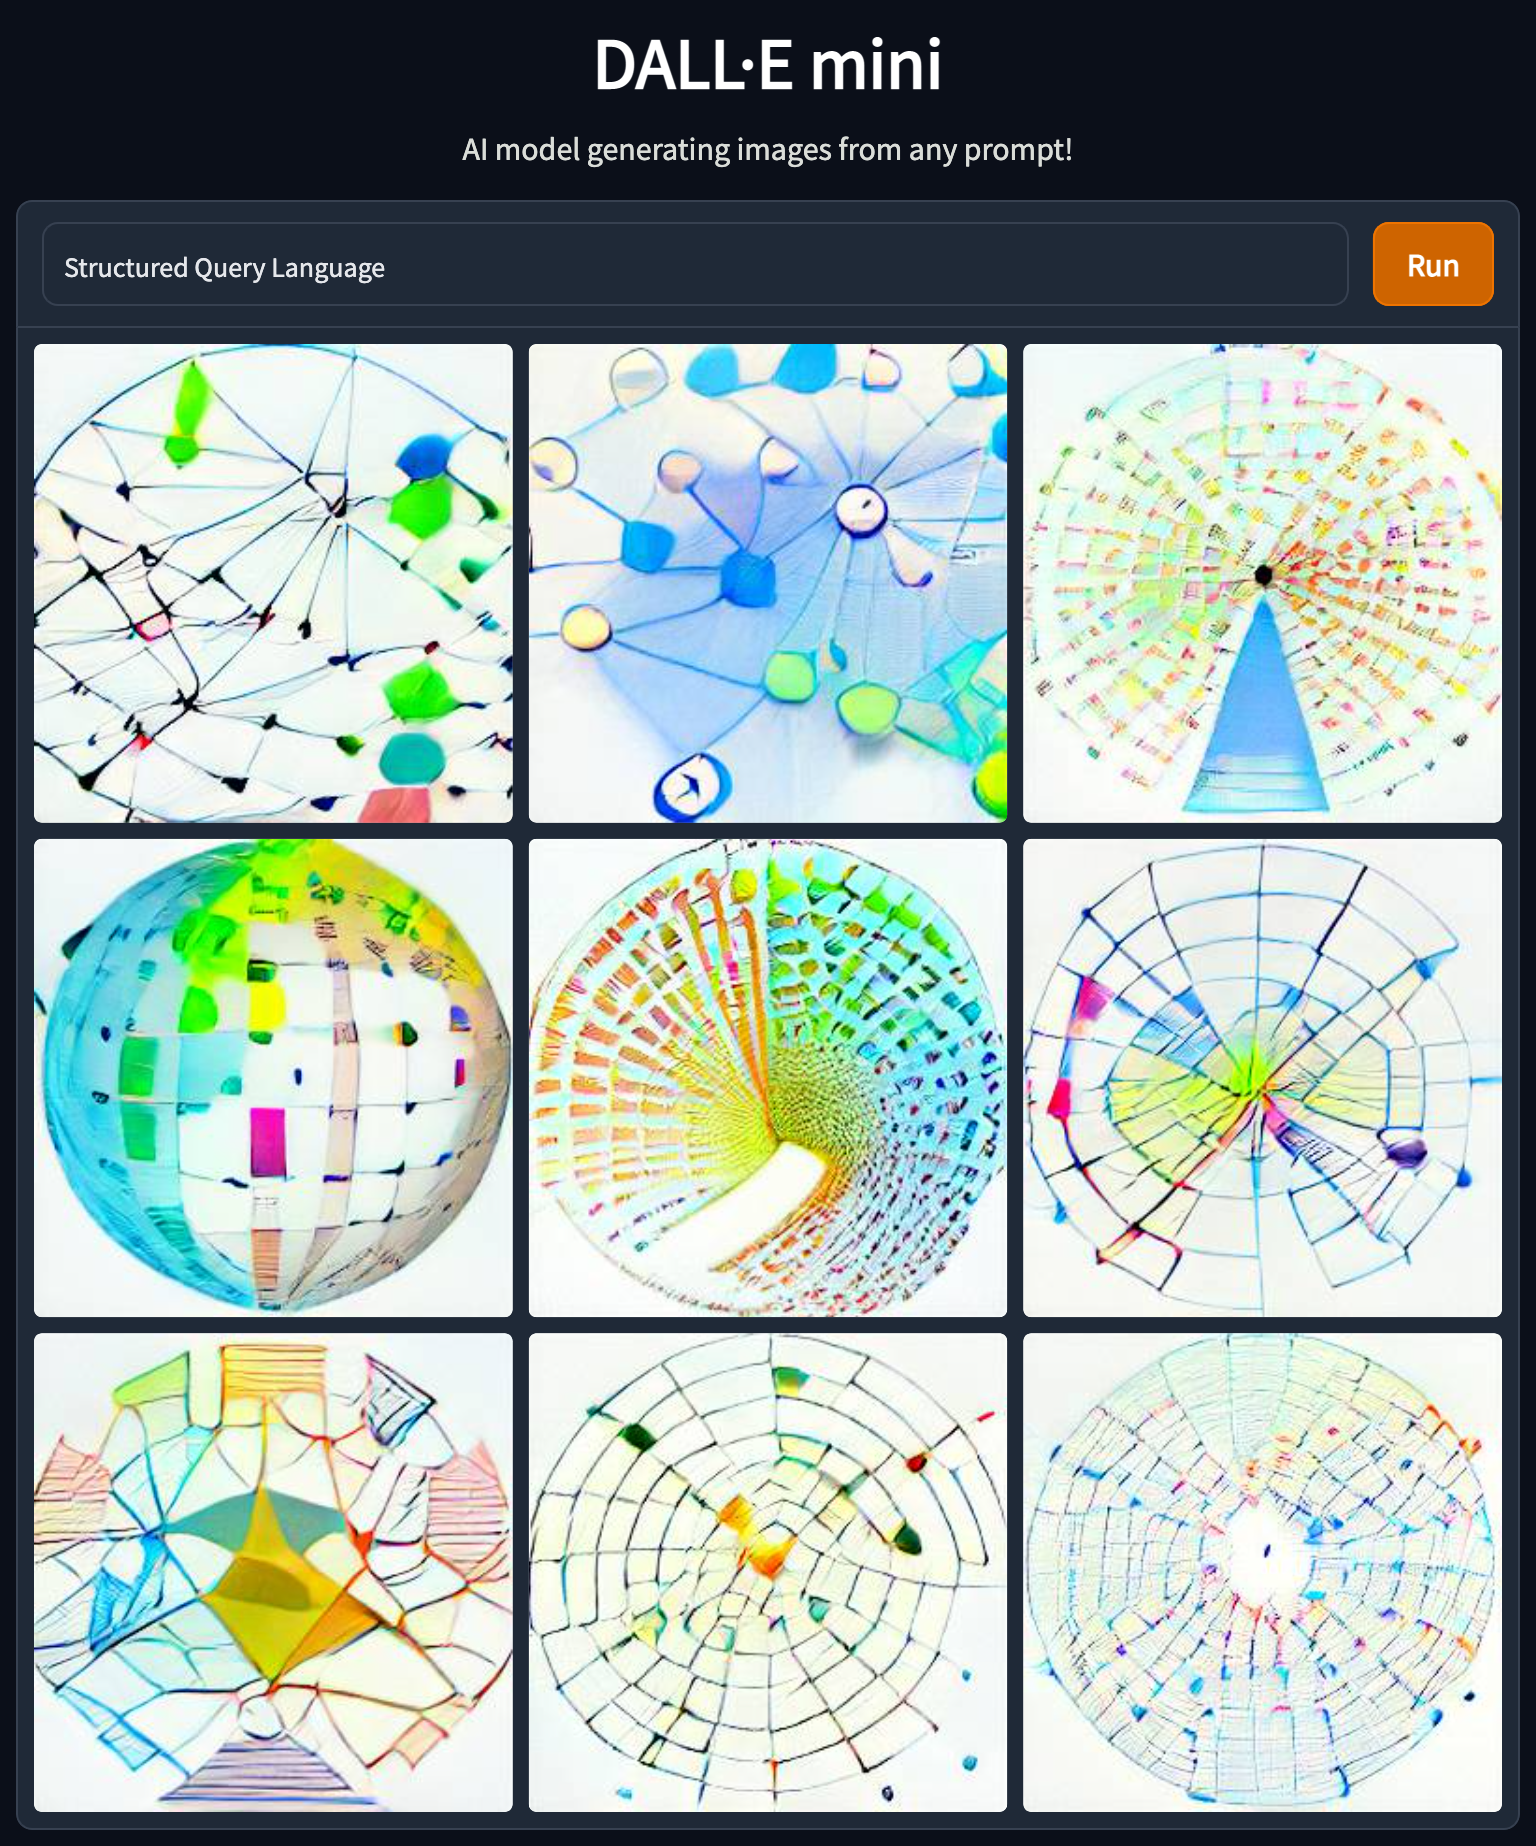
The examples above demonstrate that model does not handle abbreviations well. I can think of several reasons for that, but that emphasizes the need to use precise wording and might need to try several times to get the desired result.

Trying negation again (in this case, the abbreviation worked okish) –

SQL
NoSQL
Structured Query Language

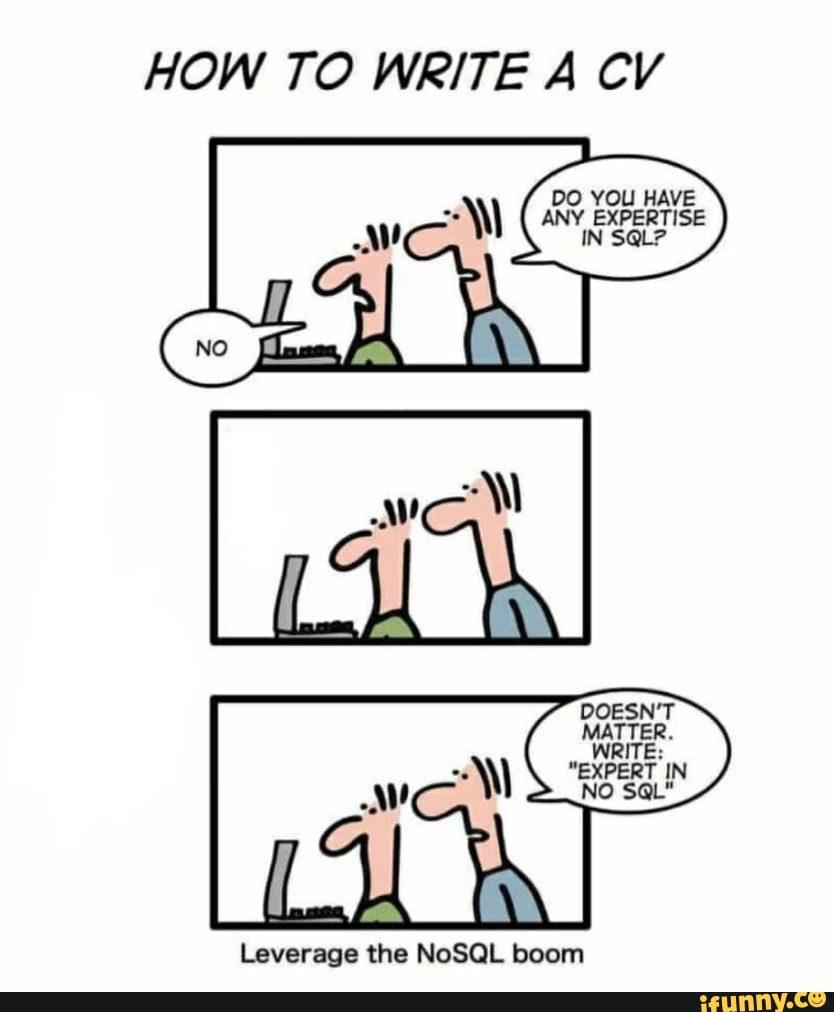
Which of course reminds all of us of this one –

And a few more –

SOLID principles
Clean Code
Computer Vision

To conclude, I cannot see a straightforward production-grade usage of this model (and it is anyhow not publically available yet) but maybe one use it for brainstorming and ideation. For me it feels like NLP in the days of TF-IDF there is yet a lot to come. Going forward I would love to have some more tunning possibilities like a color scheme or control the similarity between different results (mainly allow more diversity rather than more of the same).

Advertisement

5 interesting things (20/06/2022)

Visualizing multicollinearity in Python – I like the network one although it is not very intuitive at first sight. The others you can also get using pandas-profiling.

https://medium.com/@kenanekici/visualizing-multicollinearity-in-python-b5feedc9b3f1

Advanced Visualisations for Text Data Analysis – besides the suggested charts themselves, it is nice to get to know nxviz. I would actually like to see those charts as part of plotly as well.

https://towardsdatascience.com/advanced-visualisations-for-text-data-analysis-fc8add8796e2
Data Tales: Unlikely Plots – bar chart is boring (but informative :), but sometimes we need to think out of the box plot

https://medium.com/mlearning-ai/data-tales-unlikely-plots-1882c2a903da

XKCDs I send a lot – Is XKCD already an industry standard?

https://medium.com/codex/xkcds-i-send-at-least-once-a-month-1f6e9f9b6b89

5 Tier Problem Hierarchy – I use this framework to think of tickets I write, what is the expected input, output, and complexity, what I expect from each of my team members, etc.

https://typeshare.co/kimsiasim/posts/5-tier-problem-hierarchy-4718

Prioritize your Priority Score

A while ago, a friend asked me about a topic she needed to tackle – her team had many support tickets to prioritize, decide what to work on, and further communicate it to the relevant stakeholders.

They started as everyone starts – tier 1 and tier 2 support teams in their company stated the issue severity (low, medium, high) in the ticket, and they prioritized accordingly.

But that was not good enough. It was not always clear how to set the severity level – was it the client size or lifecycle stage, the feature importance, or anything else. Additionally, it was not granular enough to decide what to work on first.

We brainstormed, and she told me two important things for her: feature importance and client size. Both can be reduced to “t-shirt” size estimation, i.e., small client, medium client, large client, and extra-large client, and features of low/medium/high/crucial importance. Super, we can now generalize the single dimension axis system we previously had to two dimensions.

The priority score is now – \sqrt{x^2+y^2}

That worked great until they had a few tickets that got the same priority score, and they needed to decide what to work on and explain it outside of their team. The main difference between those tickets was the time it would take to fix each one. One would take several hours, one would take 1-2 days, and the last one would take two weeks and has high uncertainty. No problem, I told her – let’s add another axis – the expected time to fix. Time to fix can also be binned – up to 1 day, up to 1 week, up to 1 sprint (2 weeks), and longer. Be cautious here; the ax order is inverted – the longer it takes, the lower priority we want to give it.

The priority score is now – \sqrt[\leftroot{-2}\uproot{2}3]{x_1^3+x_2^3+x_3^3}

Then, when I felt we were finally there, she came and said – remember the time to fix dimension? Well, it is not as important as the client size and the feature importance. Is there anything we can do about it?

Sure I said, let’s add weights. The higher the weight is, the more influential the feature is. To keep things simple in our example, let’s reduce the importance of the time to fix compared to the other dimensions – \sqrt[\leftroot{-2}\uproot{2}3]{x_1^3+x_2^3+0.5 x_3^3}


To wrap things up

  1. This score can be generalized to include as many dimensions as one would like – \sqrt[\leftroot{-2}\uproot{2}n]{\sum_{i=1}^n w_i x_i^n}.
  2. I recommend keeping the score as simple and minimal as possible since it is easier to explain and communicate.
  3. Math is fun and we can use relatively simple concepts to obtain meaningful results.