Yesterday I read Boris Gorelik post – Before and after: Alternatives to a radar chart (spider chart) and I also wanted to used this visualization but using Plotly.
So I created the following gist –
This file contains hidden or bidirectional Unicode text that may be interpreted or compiled differently than what appears below. To review, open the file in an editor that reveals hidden Unicode characters.
Learn more about bidirectional Unicode characters
| import numpy as np | |
| import matplotlib.pyplot as plt | |
| import plotly.graph_objects as go | |
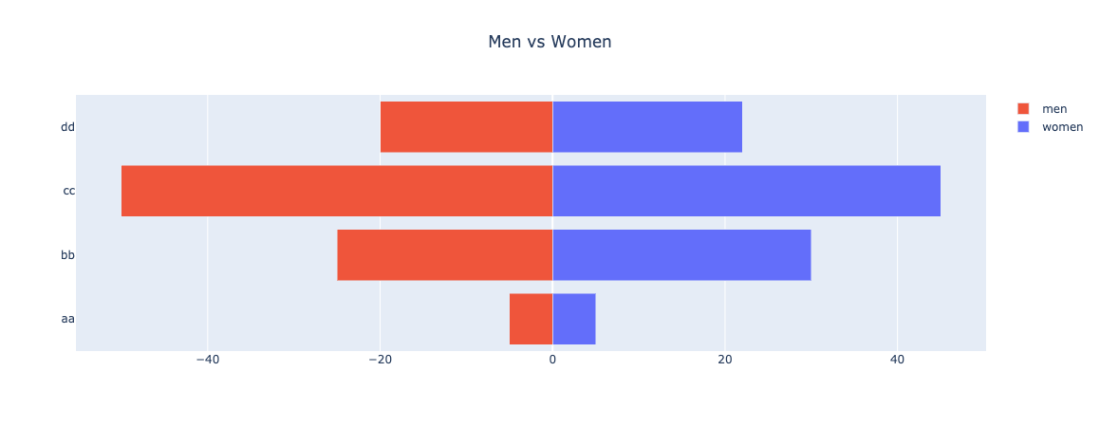
| women_pop = np.array([5., 30., 45., 22.]) | |
| men_pop = np.array( [5., 25., 50., 20.]) | |
| y = list(range(len(women_pop))) | |
| fig = go.Figure(data=[ | |
| go.Bar(y=y, x=women_pop, orientation='h', name="women", base=0), | |
| go.Bar(y=y, x=-men_pop, orientation='h', name="men", base=0) | |
| ]) | |
| fig.update_layout( | |
| barmode='stack', | |
| title={'text': f"Men vs Women", | |
| 'x':0.5, | |
| 'xanchor': 'center' | |
| }) | |
| fig.update_yaxes( | |
| ticktext=['aa', 'bb', 'cc', 'dd'], | |
| tickvals=y | |
| ) | |
| fig.show() |
