“NetworkX is a Python package for the creation, manipulation, and study of the structure, dynamics, and functions of complex networks.”
NetworkX lets the user create a graph and then study it. For example - find the shortest path between nodes, find node degree, find the maximal clique, find coloring of a graph and so on. In this post, I’ll present a few features I find interesting and are maybe less known.
Multigraphs
Multigraph is a graph that can store multiedges. Multiedges are multiple edges between two nodes (it is different from hypergraph where an edge can connect any number of nodes and no just two). NetworkX has 4 graph types - the well-known commonly used directed and undirected graph and 2 multigraphs - nx.MultiDiGraph for directed multigraph and nx.MultiGraph for undirected multigraph.
In the example below, we see that if the graph type is not defined correctly, functionalities such as degree calculation may yield the wrong value -
```python
import networkx as nx
G = nx.MultiGraph()
G.add_nodes_from([1, 2, 3])
G.add_edges_from([(1, 2), (1, 3), (1, 2)])
print(G.degree())
# [(1, 3), (2, 2), (3, 1)]
H = nx.Graph()
H.add_nodes_from([1, 2, 3])
H.add_edges_from([(1, 2), (1, 3), (1, 2)])
print(H.degree())
# [(1, 2), (2, 1), (3, 1)]
```
Create a graph from pandas dataframe
Pandas is the swiss knife of every data scientist, so naturally, it would be a good idea to create a graph from pandas dataframe. The other way around is also possible. See the documentation here. The example below shows how to create a multigraph from a pandas dataframe where each edge has a weight property.
```python
import pandas as pd
df = pd.DataFrame([[1, 1, 4], [2, 1, 5], [3, 2, 6], [1, 1, 3]],
columns=['source', 'destination', 'weight'])
print(df)
# source destination weight
# 0 1 1 4
# 1 2 1 5
# 2 3 2 6
# 3 1 1 3
G = nx.from_pandas_edgelist(df, 'source', 'destination', ['weight'],
create_using=nx.MultiGraph)
print(nx.info(G))
# Name:
# Type: MultiGraph
# Number of nodes: 3
# Number of edges: 4
# Average degree: 2.6667
```
Graph generators
O
ne of the features I find the most interesting and powerful. The graph generator interface allows creating several types we just one line of code. Some of the graphs are deterministic given a parameter (e.g complete graph of k nodes) while some are random (e.g. binomial graph). Below are a few examples of deterministic graphs and random graphs. The examples below are the tip of the iceberg of the graph generator capabilities.
Complete graph - creates a graph with n nodes and an edge between every two nodes.
Empty graph - creates a graph with n nodes and no edges.
Star graph - create a graph with one central node connected to n external nodes.
```python
G = nx.complete_graph(n=9)
print(len(G.edges()), len(G.nodes()))
# 36 9
H = nx.complete_graph(n=9, create_using=nx.DiGraph)
print(len(H.edges()), len(H.nodes()))
# 72 9
J = nx.empty_graph(n=9)
print(len(J.edges()), len(J.nodes()))
# 0 9
K = nx.star_graph(n=9)
print(len(K.edges()), len(K.nodes()))
# 9 10
```
Binomial Graph - create a graph with n nodes and each edge is created with probability p (alias for gnp_random_graph and erdos_renyi_graph).
```python
G1 = nx.binomial_graph(n=9, p=0.5, seed=1)
G2 = nx.binomial_graph(n=9, p=0.5, seed=1)
G3 = nx.binomial_graph(n=9, p=0.5)
print(G1.edges()==G2.edges(), G1.edges()==G3.edges())
# True False
```
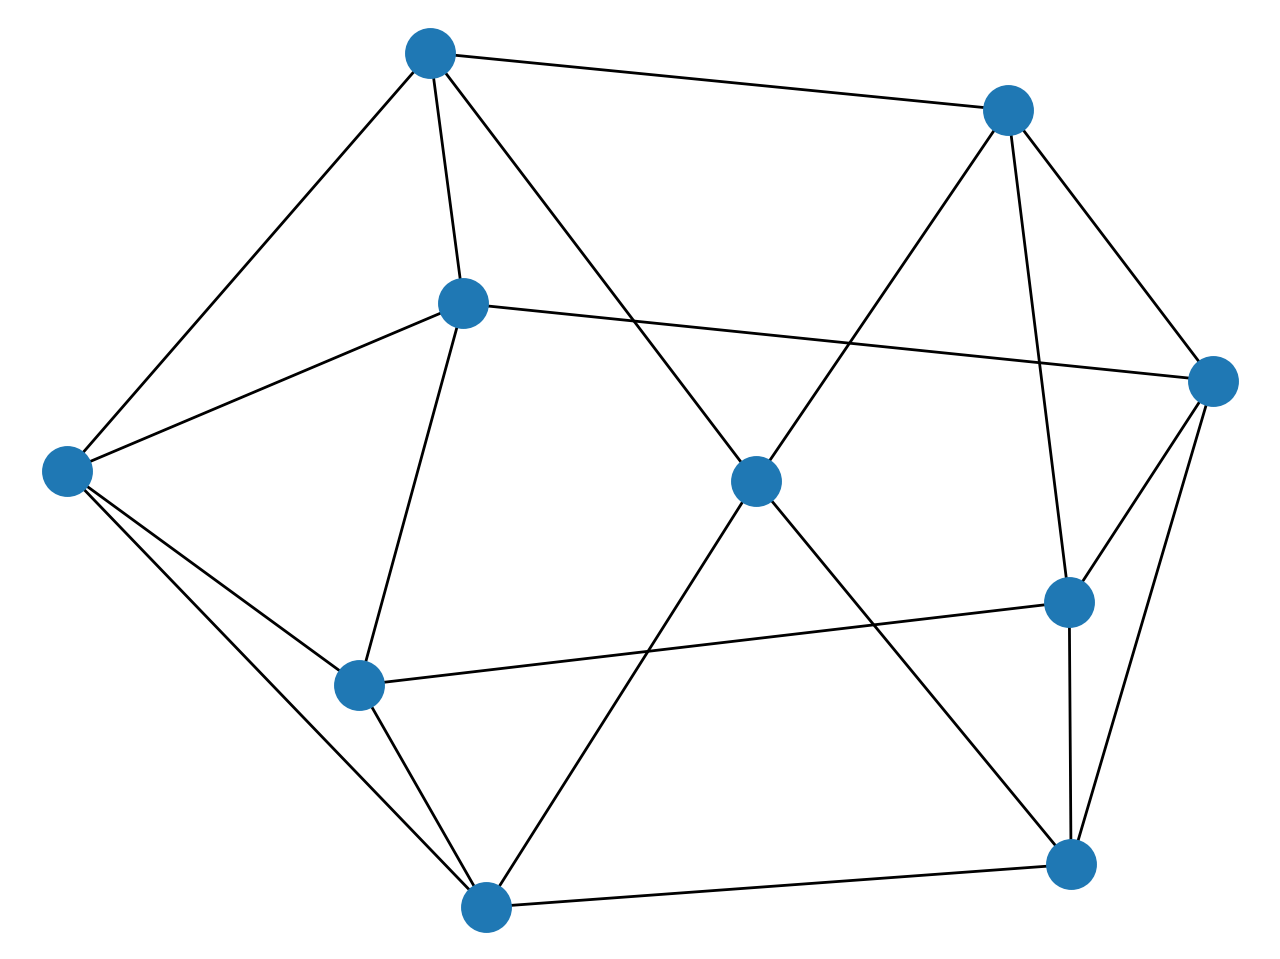
Random regular graph - creates a graph with n nodes, edges are created randomly and each node has degree d.
```python
G = nx.random_regular_graph(d=4, n=10)
nx.draw(G)
plt.show()
```
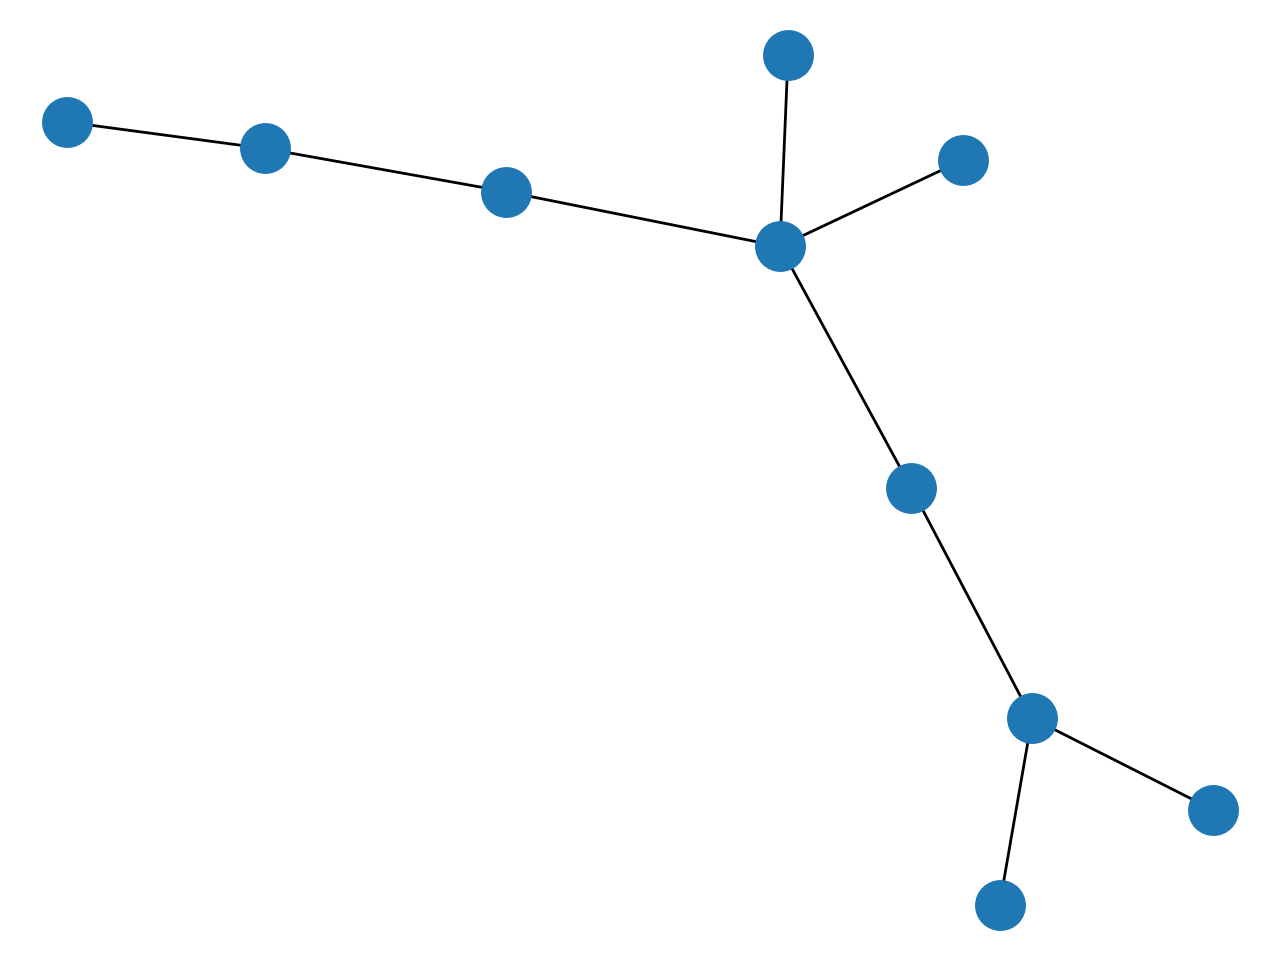
 Random tree - create a uniformly random tree of n nodes.
```python
G = nx.random_tree(n=10)
nx.draw(G)
plt.show()
```
All the code in this post can be found
here
Additional Resource
Official site
SO questions
https://www.datacamp.com/community/tutorials/networkx-python-graph-tutorial
https://www.geeksforgeeks.org/directed-graphs-multigraphs-and-visualization-in-networkx/amp/