5 interesting things (20/06/2021)

9 Steps to Software Project Handovers – handover is always a challenge and especially when a person leaves the organization and is no longer available for questions or able to access the resources. Similar issues can also arise when you leave the project for a while and then come back – you don’t alway remember all the tricks you used to run the code or the tiny bits of each function. This post suggests practical steps and behaviours that many of them can be TL;DRed with the Zen of Python – “Explicit is better than implicit.”.
https://betterprogramming.pub/9-steps-to-software-project-handovers-9325fbb72cfc

How to make an awesome Python package in 2021 – this post is a walk through building a python package. My main issue with it is the dependency management. I would put it in a different file, separate the development and usage dependency and lock the version – or shortly would rather use pipenv or poetry instead of pip but this could also be achieved with pip.

https://antonz.org/python-packaging/

A Simple Framework for Software Engineering Management – the suggested framework is indeed easy – 3 types of responsibilities (people management, delivery leadership and technical system ownership) vs 3 ranks of priorities (issues, things that are ok, ideas and aspirations). This framework is a good starting point for engineering leaders but also for engineers that can switch the people management with colleagues relations or similar or for personal growth. 

https://medium.com/swlh/a-simple-framework-for-software-engineering-management-f70b216540f2

Full Cycle Data Science (FCDS) – this is a heavy read but worth it both for data practitioners  and managers. Data science projects fail often. Sometimes it is because the problem is not defined well, other times because there is not enough data, data is not relevant, etc. FCDS tries to cast light and solve some of those problems – “In a nutshell, FCDS is a way of life that enables a single data practitioner to close the full product lifecycle and independently deliver end-to-end products, focusing only on where they bring added value”.
https://towardsdatascience.com/fcds-b2d2e6b08d34

Endorse People Publicly, and Other Actions for Allies –  Better Allies is an approach of making everyday actions to create inclusive and engaging workplaces. This post is a weekly newsletter where Karen Catlin (Advocate for Inclusive Workplaces) shares five simple actions to create a more inclusive workplace and be a better ally. This is a weekly reminder to be aware of biases and gaps and ideas to small and consistent changes that can make us and the people around us more comfortable and help everyone be the best version of themselves.
https://code.likeagirl.io/endorse-people-publicly-and-other-actions-for-allies-9352915c0956

5 interesting things – AWS edition (18/06/21)

As I collect items for my posts and wait until I have time to write about them I noticed I have many items related to AWS and decided to have a special edition.


12 Common Misconceptions about DynamoDB – many times our beliefs about certain tools or technology are based on hearing more than doing or doing but not getting into the depth of things and when running into a problem solving it with a solution we already know. This post describes features and qualities of DynamoDB that are sometimes ignored.

https://dynobase.dev/dynamodb-11-common-misconceptions/

Related Bonus – I really liked the link to Alex DeBrie post about single table design with DynamoDB

https://www.alexdebrie.com/posts/dynamodb-single-table/

AWS Chalice – it is not an official offering but rather a python code package for writing serverless applications. The syntax is very similar to Flask while there is a native support for local testing, AWS SAM and Terraform integration, etc. Disclaimer – if you are on multi-cloud I would not move from Flask or FastAPI to Chalice. Also note the used services (AWS lambda, AWS API Gateway, etc.) limits and make sure they don’t limit your app.

https://aws.github.io/chalice/index

Related Bonus – auth0 tutorial on How to Create CRUD REST API with AWS Chalice
https://auth0.com/blog/how-to-create-crud-rest-api-with-aws-chalice/


ElectricEye – “ElectricEye is a set of Python scripts (affectionately called Auditors) that continuously monitor your AWS infrastructure looking for configurations related to confidentiality, integrity and availability that do not align with AWS best practices.”. It is hard to know and follow all AWS best practices and this bundle of scripts is supposed to help uncover those. I have not tried it myself yet but it seems promising.
https://github.com/jonrau1/ElectricEye


My Comprehensive Guide to AWS Cost Control – computing and cloud costs take a big portion of every tech organization those days. Being a more valuable team member also means being aware of the costs and choosing wisely between the different alternatives.

https://corey.tech/aws-cost/


The Best Way To Browse 6K+ Quality AWS GitHub Repositories – most of the time we are not inventing the wheel and someone probably already did something very similar to what we are doing. Let’s browse github to find it and accelerate our process.

https://app.polymersearch.com/discover/aws

Bonus – AWS snowball – I found out that this service exists only this week and it blew my mind – https://aws.amazon.com/snowball/

5 interesting things (06/05/2021)

How Hashicorp works – Hashicorp develops open-source products that are widely used in the industry including Terraform, Vault, Consul, etc. “How HashiCorp Works” provides a glimpse of Hashicorp’s culture and practices. I appreciate this kind of transparency and chance to learn. 

https://works.hashicorp.com/

Make boring plans – a more accurate title would be “make predictable plans”. That is, the next tasks should be predictable based on the team’s knowledge regarding the product pains, bug, customers’ requests, etc.A possible good way to measure how boring the plans are is to ask the team to prioritize the top-k tasks we should work on in the next period (quarter \ sprint, etc.) and check if the tasks overlap. Disclaimer – each team member has its’ own view, pain points, and features they would like to develop and might be biased towards it.

https://skamille.medium.com/make-boring-plans-9438ce5cb053

Explainable AI Cheat Sheet  – cheat sheet, video and resources regarding XAI. This is a very good way to get into this field.

https://ex.pegg.io/

I’ve code reviewed over 750 pull requests at Amazon. Here’s my exact thought process – code review is an art and is a way personal relations manifest themselves. One day I might write a longer post about code reviews but for now I want to focus on the last 2 points in this post – “I approve when the PR is good, not perfect” and “I seek feedback for whether I’m reviewing well”. “Good not perfect” – this depends on the team standards, DoD, the PR scope, etc. Specifically, in startups when the time and money are limited each delay has its’ costs. “I seek feedback” – how is the quality of my CR is measured? what are the goals of CR (familiarity with the code, finding bugs, enforcing standards, something else?)?. I would like to see or find ways to assess the quality of the CR and give feedback to the code reviewer.

https://curtiseinsmann.medium.com/ive-code-reviewed-over-750-pull-requests-at-amazon-here-s-my-exact-thought-process-cec7c942a3a4


My Clean and Tidy Checklist for Clean and Tidy Data – it is commonly believed that “Data scientists spend 80% of their time cleaning data”. This post provides a conceptual framework to clean data so the time data scientist spend on cleaning data might drop to 79% 😉

https://towardsdatascience.com/my-clean-and-tidy-checklist-for-clean-and-tidy-data-fbdeacb3736c

5 interesting things (23/04/21)

You Are Probably Not Making The Most of Pandas “read_csv” Function – this might seems trivial and everything can be found in the documentation but it is well served here with many examples.
https://towardsdatascience.com/you-are-probably-not-making-the-most-of-pandas-read-csv-function-51bcf069e646

Disasters I’ve seen in a microservices world – I experienced most of the disasters described in this post and totally agree with the bottom line – “These edge cases become the new normal at a certain scale, and we should cope with them.”

https://world.hey.com/joaoqalves/disasters-i-ve-seen-in-a-microservices-world-a9137a51

Chess2Vec – while there are many x2Vec works in recent years this work is passion-based. The writer informatics profess that wanted to apply the algorithm to a hobby of his – chess. I think this is a great example of side project and I would love to see more such combinations.
https://towardsdatascience.com/chess2vec-map-of-chess-moves-712906da4de9

Driving Cultural Change Through Software Choices – there are several approaches on who to drive changes this post presents a somehow more immediate approach, straight-forward and role model approach. The author’s idea is that if you choose or provide the tools that reflect your values your team will also adopt them.

https://skamille.medium.com/driving-cultural-change-through-software-choices-bf69d2db6539

Letter to (new) managers – an insightful post for managers and people who strive to become managers. Two quotes I liked – “Trust is consistency over time” and “We start managing others the way we manage ourselves, but to do better, we need to learn new tools and use them adaptively.”. Managing others the way we manage ourselves is one of the most common mistakes I saw managers do and I try to be super aware to it myself.

https://productlessons.substack.com/p/letter-to-new-managers

5 tips for using Pandas

Recently, I worked closely with Pandas and found out a few things that are might common knowledge but were new to me and helped me write more efficient code in less time.


1. Don’t drop the na

Count the number of unique values including Na values.

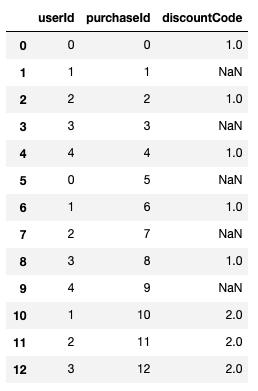
Consider the following pandas DataFrame –

df = pd.DataFrame({"userId": list(range(5))*2 +[1, 2, 3],
                   "purchaseId": range(13),
                   "discountCode": [1, None]*5 + [2, 2, 2]})

Result

If I want to count the discount codes by type I might use –  df['discountCode'].value_counts() which yields – 

1.0    5
2.0    3

This will miss the purchases without discount codes. If I also care about those, I should do –

df['discountCode'].value_counts(dropna=False)

which yields –

NaN    5
1.0    5
2.0    3

This is also relevant for nuniqiue. For example, if I want to count the number of unique discount codes a user used – df.groupby("userId").agg(count=("discountCode", lambda x: x.nunique(dropna=False)))

See more here – https://pandas.pydata.org/pandas-docs/stable/reference/api/pandas.DataFrame.nunique.html

2. Margin on Row \ columns  only

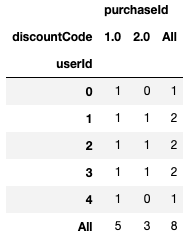
 Following the above example, assume you want to know for each discount code which users used it and for each user which discount code she used. Additionally you want to know has many unique discount codes each user used and how many unique users used each code, you can use pivot table with margins argument –

df.pivot_table(index="userId", columns="discountCode",
               aggfunc="nunique", fill_value=0,
               margins=True)

Result –

It would be nice to have the option to get margins only for rows or only for columns. The dropna option does not act as expected – the na values are taken into account in the aggregation function but not added as a column or an index in the resulted Dataframe.

3. plotly backend


Pandas plotting capabilities is nice but you can go one step further and use plotly very easy by setting plotly as pandas plotting backend.  Just add the following line after importing pandas (no need to import plotly, you do need to install it) –

pd.options.plotting.backend = "plotly"

Note that plotly still don’t support all pandas plotting options (e.g subplots, hexbins) but I believe it will improve in the future. 


See more here – https://plotly.com/python/pandas-backend/


4. Categorical dtype and qcut

Categorical variables are common – e.g., gender, race, part of day, etc. They can be ordered (e.g part of day) or unordered (e.g gender). Using categorical data type one can validate data values better and compare them in case they are ordered (see user guide here). qcut allows us to customize binning for discrete and categorical data.

See documentation here and the post the caught my attention about it here – https://medium.com/datadriveninvestor/5-cool-advanced-pandas-techniques-for-data-scientists-c5a59ae0625d

5. tqdm integration


tqdm is a progress bar that wraps any Python iterable, you can also use to follow the progress of pandas apply functionality using progress_apply instead of apply (you need to initialize tqdm before by doing tqdm.pandas()).

See more here – https://github.com/tqdm/tqdm#pandas-integration

5 interesting things (04/12/2020)

How to set compensation using commonsense principles – yet another artwork by Erik Bernhardsson. I like his analytics approach and the way he models his ideas. His manifest regarding compensation systems (Good/bad compensation systems) is brilliant. I believe most of us agree with him while he put it into words. His modeling has some drawbacks that he is aware of. For example, assuming certainty in employee productivity, almost perfect knowledge of the market. Yet, it is totally worth your time.

https://erikbern.com/2020/06/08/how-to-set-compensation-using-commonsense-principles.html

7 Over Sampling techniques to handle Imbalanced Data – imbalanced data is a common real world scenario, specifically in healthcare where most of the patients don’t have a certain condition one is looking for. Over-sampling is a method to handle imbalanced data, this post describes several techniques to handle it. Interestingly, at least in this specific example, most of the techniques do not bring significant improvement. I would therefore compare several techniques and won’t just try one of them. 
https://towardsdatascience.com/7-over-sampling-techniques-to-handle-imbalanced-data-ec51c8db349f

This post uses a the following package which I didn’t know before (it would be great if it could become part of scikit-learn) – https://imbalanced-learn.readthedocs.io/en/stable/index.html

It would be nice to see a similar post fo downsampling techniques.


Python’s do’s and don’t do – very nicely and written with good examples – 
https://towardsdatascience.com/10-quick-and-clean-coding-hacks-in-python-1ccb16aa571b

Every Complex DataFrame Manipulation, Explained & Visualized Intuitively – can’t remember how pandas function work? great, you are not alone. You can use this guide to quickly remind you how melt, explode, pivot and others work.
https://medium.com/analytics-vidhya/every-dataframe-manipulation-explained-visualized-intuitively-dbeea7a5529e

Causal Inference that’s not A/B Testing: Theory & Practical Guide – Causality is often overlooked in the industry. Many times you developed a model that is “good enough” and move on. However, this might increase bias and lead to unfavourable results. This post suggests a hands-on approach to causality accompanied by code samples.

https://towardsdatascience.com/causal-inference-thats-not-a-b-testing-theory-practical-guide-f3c824ac9ed2

Plotly back to back horizontal bar chart

Yesterday I read Boris Gorelik post – Before and after: Alternatives to a radar chart (spider chart) and I also wanted to used this visualization but using Plotly.

So I created the following gist –

import numpy as np
import matplotlib.pyplot as plt
import plotly.graph_objects as go
women_pop = np.array([5., 30., 45., 22.])
men_pop = np.array( [5., 25., 50., 20.])
y = list(range(len(women_pop)))
fig = go.Figure(data=[
go.Bar(y=y, x=women_pop, orientation='h', name="women", base=0),
go.Bar(y=y, x=-men_pop, orientation='h', name="men", base=0)
])
fig.update_layout(
barmode='stack',
title={'text': f"Men vs Women",
'x':0.5,
'xanchor': 'center'
})
fig.update_yaxes(
ticktext=['aa', 'bb', 'cc', 'dd'],
tickvals=y
)
fig.show()

How to manage remote teams – 3 insights from GitLab’s course in Coursera

I have recently listened to GitLab’s “Remote management course” in Coursera. While there are companies that are remote-first and were built like that or chose to adopt this structure (or other remote work structures) with the outbreak of COVID-19 many companies were forced to change and adopt remote work. This course timing is relevant than ever. Here are few insights –

  1. This course is a great PR for GitLab they present a well-studied background and ideas of remote work, including pros, cons, and trade-offs. They present their take on remote work and how it is implemented in GitLab and refer to their own handbook and resources. Additionally, course lecturers are very diverse, which I believe can be attractive to many candidates. 
  2. Physical health and specifically mental health are mentioned multiple times during the course. Working remotely raises mental health challenges which are important to mention and I’m glad they did it.  Specifically during the pandemic where interactions with other decreases and many employees didn’t choose this form of work in advance.
  3. What is a vital capability for remote employees? communication. They preach to value strong communication skills and emphasize that it is crucial in an asynchronous work environment where your colleagues are in different time zones, have varied cultural backgrounds and it might take them hours or days to answer. Well, I think it is also important for colocated employees.  Interactions with others shape our days, sometimes more than our actual tasks and it is important to be in an environment where we feel comfortable and even if we have disagreements (and I would be worried if there aren’t) they can be discussed and settled. Generally, I find many of their ideas also relevant for colocated work.

Personally, I like working remotely as it saves the commute and allows me flexible working hours. However, in the past, I had the experience of being the only remote employee and that didn’t work well. Many of the communication was in the coffee corner and was not accessible to me, promotion paths were blocked, etc.

If you are looking for a remote position, I strongly suggest this great resource – Established remote companies.

Getting started with Fairness in ML – 5 resources

Mirror Mirror – Reflections on Quantitative Fairness – this is one of the first pieces I read about algorithmic fairness and caught my attention. It surveys the most common definitions of fairness together with relevant examples in a readable format.

https://shiraamitchell.github.io/fairness/

Fairness in Machine Learning book – a WIP of an online textbook about fairness and machine learning by very notable researchers in this field – Solon Barocas, Moritz Hardt, Arvind Narayanan.

https://fairmlbook.org/

Equality of Opportunity in Supervised Learning – if you want to read a research paper about fairness this paper by Moritz Hardt, Eric Price and Nathan Srebro is a good starting point. It is central and relatively easy to read. It defines “Equalized odd” and “Equal opportunity” fairness measures which are commonly used and also gives a geometric intuition.

https://arxiv.org/abs/1610.02413

Responsible Data Science course – a wider view than just fairness. This course is given by Julia Stoyanovich at New York University and includes topics in data cleaning, anonymity explainability, etc. If you look for a pertinent reading list you can find it there.

https://dataresponsibly.github.io/courses/spring20/

AIF360 – A tooling containing metrics for datasets and models to test for biases and algorithms to mitigate bias in datasets and models. The package is available in both Python and R. 
AIF360 was originally developed by IBM and was recently donated to Linux Foundation AIAmong the currently available software tools, I find this the most baked and stable one. 

https://github.com/Trusted-AI/AIF360

5 interesting things (8/6/2020)

DBScan practitioners guide – DBScan is a density-based clustering method. One important advantage comparing to K-means is DBScan’s ability to identify noise and outliers. I feel that  DBScan is often under-estimated. See this guide to learn more on how DBScan works, how to choose hyperparameters and more.

https://towardsdatascience.com/a-practical-guide-to-dbscan-method-d4ec5ab2bc99

Fourier Transform for Data Science – When I was in undergrad school I learned FFT out of context, it was just an algorithm in the textbook and I didn’t understand what it was good for. Later I was asked about it in an oral in grad school and was able to mumble something. Much later I tried to pull some analysis on ECG waves and then I finally understood what it was about.Read this post if you want to demystify Fourier transform. 

https://medium.com/swlh/fourier-transformation-for-a-data-scientist-1f3731115097

Bonus – OpenCV tutorial on Fourier Transform

https://opencv-python-tutroals.readthedocs.io/en/latest/py_tutorials/py_imgproc/py_transforms/py_fourier_transform/py_fourier_transform.html

Dataset shift – dataset shift happens when the test set and the train set come from different distributions. There are multiple expressions of this phenomenon, such as covariate shift, concept shift, prior distribution shift. I believe that every data scientist working in the industry came across at least one of those manifestations. This post provides a very good introduction to the topic and useful links if you want to delve.

https://towardsdatascience.com/understanding-dataset-shift-f2a5a262a766

A Practical Framework for AI Adoption: A Five-Step Process – having several years of experience as a data scientist I have noticed that data products are often not deployed, do not meet stakeholders’ expectations, not used as the data scientist intended, etc. This post introduces a framework that tries to remedy some of those problems.

https://datascientia.blog/2020/05/23/framework-for-ai-adoption-a-five-step-process/

Diagrams as code – a code-based tool to draw system diagrams, possibly easier than fighting draw.io. It contains many icons including several cloud providers (AWS, GCP, Azure, etc). common servicers (K8S, Elastic, spark), etc. All in all, seems very promising.

https://diagrams.mingrammer.com/